Published on: 2025-10-10
Updated on: 2025-10-10
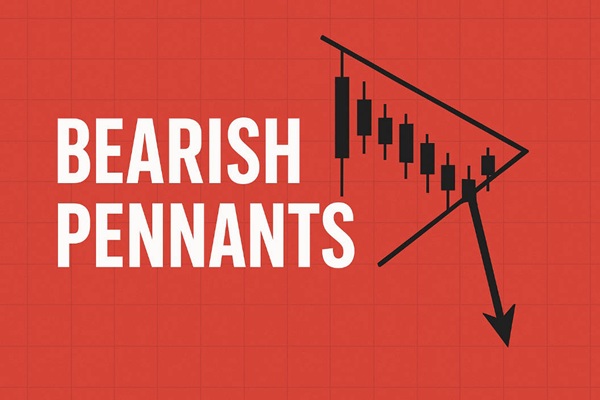
A bearish pennant is a continuation pattern that typically appears after a sharp downward move; it signals a likely resumption of the decline once price breaks down from a brief converging consolidation.
This article explains the structure, detection criteria, trading mechanics, confirmation techniques and risk controls you should use when trading bearish pennants.
The bearish pennant is a useful continuation pattern when it appears after a convincing downward move and satisfies volume and shape criteria.
Trade it with disciplined entry confirmation, a logical stop above the pennant, and a target derived from flagpole projection.
Use volume and at least one momentum indicator to filter false breakouts, and always manage risk through position sizing and stops.
Backtest and journal trades to develop a personalised, repeatable approach — the pattern delivers best results as part of a coherent trading plan, not as a standalone signal.

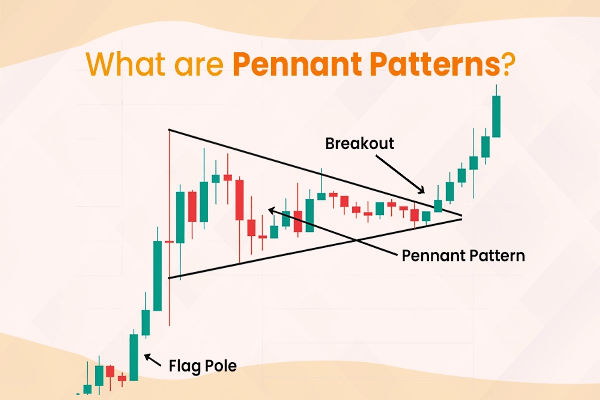
A bearish pennant is a short-term consolidation pattern that follows a pronounced price decline (the flagpole) and takes the shape of a small symmetrical triangle (the pennant).
It is interpreted as a continuation pattern: after sellers force price down, market participants pause and trade in a narrowing range; when sellers regain control the previous downtrend typically resumes.
Traders use the pattern because it offers defined entries, stops and measurable profit targets.
Flagpole: the preceding, relatively steep fall in price. This shows momentum and creates the base measurement for projecting a target.
Pennant (consolidation): a brief period of lower volatility in which prices form converging trend lines (higher lows and lower highs). The pennant represents indecision and a reduction in trading volume.
Breakdown: the decisive move below the lower pennant trend line — ideally accompanied by a spike in volume — which signals renewed selling pressure and continuation of the downtrend.
Psychology: early sellers have already driven price lower; the pennant lets some participants consolidate positions or unwind; a breakdown indicates sellers overwhelmed buyers again.

Use this checklist to decide whether a pattern is tradable.
The preceding decline should be clear and reasonably sharp relative to recent price action. A short, distinct flagpole is preferable.
The consolidation should form a small symmetrical triangle with two near-converging trend lines. Wide or long consolidations are less reliable.
Volume typically falls during the pennant formation and should expand on the breakdown.
The pennant should not retrace too much of the flagpole (a deep retracement suggests a different pattern).
The pennant is short-lived relative to the flagpole (often lasting from several bars up to a few weeks depending on timeframe).
See the validation checklist table below for a compact summary.

Wait for a close below the pennant's lower trend line.
Better confirmation: a breakdown accompanied by increased volume or a momentum indicator confirming bearish bias.
Alternative aggressive entry: enter on the first break below the trend line (accept higher chance of false breakout).
Conservative: just above the most recent swing high or the upper pennant trend line.
Tighter: above the high of the breakout candle (if you require a closer stop and take on greater chance of being stopped out).
Measure the flagpole height: distance from the start of the fall to the top of the pennant.
Project that distance downward from the breakdown point — this gives a first objective.
Consider existing support zones and previous swing lows as additional targets or to adjust expectations.
Calculate size so that the monetary risk (entry to stop) matches your pre-determined risk per trade (e.g. 1% of account).
Use scaling out or a trailing stop to lock profits as the trade moves in your favour.

Use these tools to reduce false breakouts and improve probability:
Volume: look for contraction during the pennant and a clear volume increase on the breakdown.
RSI: a falling or oversold RSI at breakdown supports bearish continuity.
MACD: a bearish MACD crossover or negative histogram expansion on breakdown adds weight.
Moving averages: price below a medium-term moving average (e.g. 50-period) strengthens the case for continuation.
Support / resistance and Fibonacci levels: check if the projected target coincides with prior support — this will often reduce the upside of the projected move.
Below is a simple, hypothetical trade illustrating measurement and risk-reward.
| Item |
Value / calculation | Note |
|---|---|---|
| Flagpole start price | 100 | start of sharp decline |
| Pennant top (flagpole end) | 80 | top of consolidation |
| Flagpole height | 20 | 100.00 − 80.00 |
| Breakout (entry) price | 85 | price closes below lower pennant line |
| Target (flagpole projection) | 65 | 85.00 − 20.00 |
| Stop-loss | 90 | above upper pennant trend line |
| Risk per share | 5 | 90.00 − 85.00 |
| Reward per share | 20 | 85.00 − 65.00 |
| Risk : Reward | 1:04 | favourable setup |
Use this table to calculate position size: if your acceptable risk is £200. position size = £200 / risk per share (i.e. 200/5 = 40 shares).
False breakouts: a price break below the pennant followed by a rapid reversal is common. Mitigation: wait for a daily close (on daily charts) or volume confirmation.
Misidentification of pattern: flags, wedges and symmetrical triangles can look similar. Ensure the context is a preceding strong decline and that the consolidation is relatively brief.
Ignoring news / catalysts: macroeconomic announcements or corporate news can invalidate technical patterns. Avoid initiating new trades immediately ahead of known major events.
Poor risk control: inadequate stop placement or oversized positions turn otherwise good setups into account-threatening trades.
The overall trend is strongly downwards across multiple timeframes.
Volume behaviour conforms to the expected pattern (contraction then expansion).
No major economic or company-specific events are imminent.
The consolidation is unusually long or the pennant shape is unclear.
Market is range-bound or lacks a dominant directional bias.
Volatility is driven by news rather than technical structure.
Backtest the bearish pennant criteria on your chosen market and timeframe to estimate win rate and average return. Use consistent entry and exit rules.
Keep a trade journal that records: pattern image, entry, stop, target, outcome, and notes on why the trade worked or failed.
Review periodically and refine rules (for example, minimum flagpole length, acceptable pennant duration).
Backtest the pattern on at least two markets (e.g. equities and forex) and two timeframes.
Practise spotting the pattern on historical charts: mark flagpole, pennant, breakdown and actual outcome.
Combine technical pattern recognition with robust money management: this is usually where profitable traders separate themselves from amateurs.
A bullish pennant pattern signals temporary consolidation within an established uptrend.
When traded with confirmation and disciplined risk management, the bullish pennant offers a high-quality continuation setup with well-defined parameters.
Typically one to three weeks on daily charts, or a few sessions on intraday timeframes, depending on volatility.
Yes. A failed pattern occurs when price breaks above the upper trendline instead of below, often due to a shift in market sentiment or weak volume confirmation.
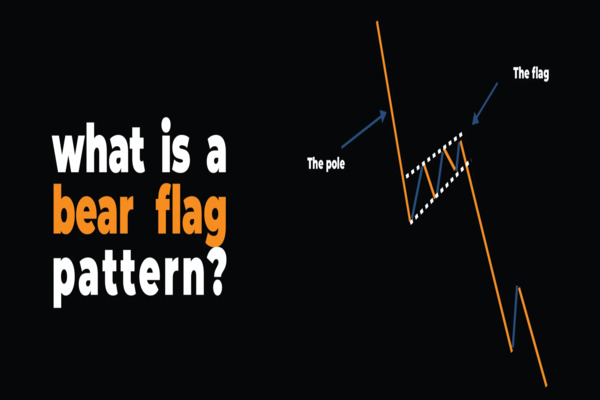
No. A bear flag forms between parallel lines, while a bearish pennant has converging trendlines forming a small triangle.
They appear on all timeframes but are generally more reliable on 4-hour, daily, or weekly charts, where price noise is reduced.
Yes. The pattern reflects crowd psychology, not asset type, so it appears in stocks, forex, commodities, and crypto alike.
Disclaimer: This material is for general information purposes only and is not intended as (and should not be considered to be) financial, investment or other advice on which reliance should be placed. No opinion given in the material constitutes a recommendation by EBC or the author that any particular investment, security, transaction or investment strategy is suitable for any specific person.


World's Best Broker