Published on: 2025-07-04
Updated on: 2025-10-01
Imagine price as a runner sprinting up a staircase. In the rush, it skips a few steps, leaving gaps. Those skipped steps are "fair value gaps" (FVGs), untraded prices where the market moved too quickly.
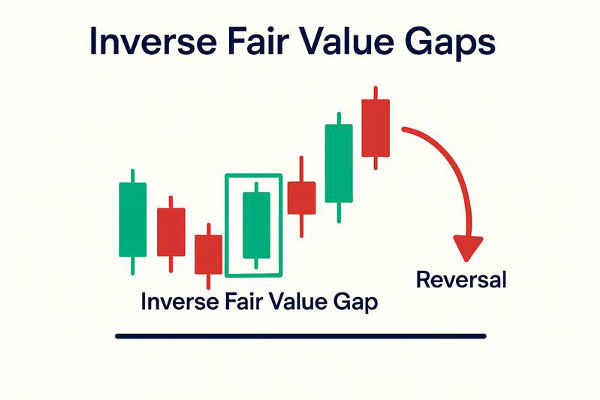
Now picture a brief catch-your-breath shuffle in the opposite direction during that sprint. The gap created by that quick counter-move is the inverse fair value gap (IFVG). It's the mirror-image imbalance that often pulls price back or caps it temporarily, giving traders clean entries, exits, and intraday targets.
In short, an inverse fair value gap is a former fair value gap that has been invalidated by price and then treated as support or resistance in the opposite direction, which traders use to mark a shift in order flow and structure
.

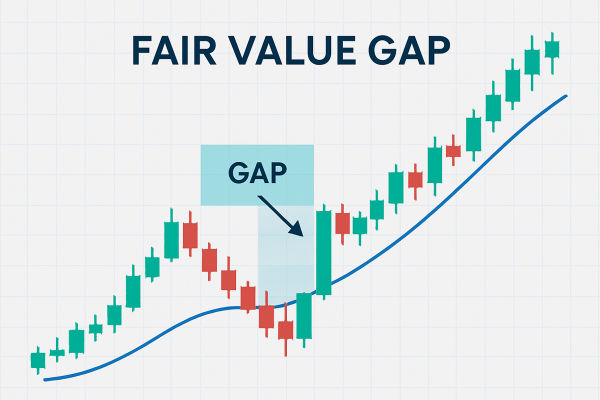
In traditional SMC, a Fair Value Gap is an imbalance in price action where the market moves so quickly in one direction that it leaves behind an untraded zone. It typically occurs during news releases, institutional buying or selling, or high-momentum breakouts.
An FVG is identified on a three-candle sequence where:
The middle candle's body has a strong move (either bullish or bearish).
The candles before and after the move do not overlap with the middle candle's wick.
It creates a "gap" in the price where liquidity is thin or absent.
Institutional traders often revisit these zones to "fill" the gap and collect unfilled orders, making them ideal entry points for retail traders following Smart Money footprints.

An Inverse Fair Value Gap (IFVG) refers to a price discrepancy on a chart where liquidity from the opposing side is involved. Unlike a traditional Fair Value Gap, which indicates where price skipped levels due to aggressive buying or selling, an IFVG shows the market has reversed in a way that leaves behind an inefficiency on the opposite side.
In simple terms:
Fair Value Gap (FVG): Happens when price moves too quickly in one direction, leaving untraded "air" on the chart.
Inverse Fair Value Gap (IFVG): Appears when the market retraces or reverses aggressively, leaving a mirrored imbalance.
It's like throwing a ball hard against a wall. The initial throw (FVG) creates force in one direction. But when the ball bounces back harder than expected, it leaves a new imbalance: the IFVG.
To spot IFVGs, traders usually analyse three consecutive candlesticks:
Candle A (the impulse): the initial strong move that creates a gap.
Candle B (the retracement): price retraces, leaving part of Candle A's range untested.
Candle C (the inverse push): price moves in the opposite direction, confirming the imbalance.
When Candle C leaves a gap opposite to the original move, you have an IFVG.
Example: On a 15-minute GBP/USD chart, if a bullish candle (Candle A) drives price upward, followed by a retracement (Candle B), and then a bearish candle (Candle C) closes deep below Candle A's midpoint, it may leave an inverse gap where price is likely to rebalance later.

Zoom Out: Start by identifying the overall trend on higher timeframes (4H, Daily).
Spot the Impulse Move: Look for a strong candle that leaves a noticeable gap.
Wait for the Inverse Move: Check if the opposite candle creates an imbalance.
Mark the Gap Zone: Highlight the price range of the imbalance (often the wick-to-body region).
Monitor Price Action: Wait for price to revisit and react to the IFVG zone before entering.
| Feature | Fair Value Gap (FVG) | Inverse Fair Value Gap (IFVG) |
|---|---|---|
| Formation | Strong move in one direction skips price levels | Opposite move over-corrects, leaving a mirrored imbalance |
| Market Signal | Indicates continuation potential | Suggests reversal or retracement potential |
| Liquidity Focus | Unfilled orders in skipped zone | Trapped traders on the wrong side |
| Trader Use | Entry point in direction of trend | Spotting exhaustion and reversal setups |
In short, FVGs are about momentum continuation, while IFVGs are often about momentum reversal.
Understanding IFVGs helps traders in three key ways:
Spotting Reversals Early: IFVGs often mark when aggressive buyers or sellers are trapped, hinting at a trend change.
Identifying Liquidity Zones: They reveal areas where price may revisit to "rebalance" before resuming the trend.
Risk Management: Using IFVGs can aid in establishing stricter stop losses, as invalidation points tend to be evident.
For beginners, think of IFVGs as footprints left by smart money; it's the moment the market slightly overreacts and subsequently works to readjust.
In February 2025, after the European Central Bank hinted at delaying rate cuts, EUR/USD spiked sharply. Within hours, the pair retraced violently, leaving behind a bearish IFVG around the 1.045–1.050 zone.
Traders who spotted this imbalance saw the price later return to "fill" that IFVG before resuming its downtrend.
Tesla's Q2 2025 update and the July 23 earnings-related call produced notable volatility. [1]
Shares traded around $331 on July 23, 2025 and fell to about $305 on July 24, 2025 (roughly an 8% move on the news), leaving intraday price imbalance zones on the daily chart that could act as IFVG-like liquidity zones for subsequent retracements.
On a low-liquidity Sunday in May 2025, Bitcoin surged from $105 to $111k before crashing back. The aggressive reversal created an IFVG in the $104,000–$106,000 range. In the following week, BTC retraced to that zone before continuing its broader uptrend. [2]

Now that you know how to spot IFVGs, here's how to turn them into trades.
Entry Rules
Identify the IFVG zone on a 15M, 1H, or 4H chart.
Wait for the price to return to the IFVG zone.
Enter in the direction of the inverse move (if bearish IFVG, sell when price re-enters zone).
Stop-Loss Placement
Place stops just outside the IFVG zone.
This ensures that if the gap fully breaks, your risk is minimised.
Take-Profit Targets
First target: nearest support/resistance level.
Second target: previous swing high/low.
Optional trailing stop to capture extended moves.
Trading Every Gap: Not all imbalances are valid IFVGs.
Ignoring Trend Bias: IFVGs against a strong higher-timeframe trend often fail.
Forcing Entries: Entering before price revisits the IFVG zone leads to unnecessary losses.
Over-leveraging: Due to the appealing nature of IFVGs, traders occasionally take excessive risks, blowing accounts when they fail.
To improve accuracy, traders often combine IFVG with:
Break of Structure (BOS): IFVG after a BOS gives stronger confirmation.
Order Blocks: Overlapping IFVG + order block = high-probability zone.
Volume Analysis: High-volume IFVG zones tend to be more reliable.
Indicators: RSI divergence or moving averages can validate IFVG setups.
By stacking confluences, traders can filter out weak setups and trade only the strongest signals.
| Pros | Cons |
|---|---|
| Works across markets (forex, stocks, crypto) | Can produce false signals in ranging markets |
| Offers clear zones for entries & stops | Requires patience as price may take time to revisit zone |
| Aligns with smart money / liquidity concepts | Needs strong risk management to avoid over-trading |
| Enhances risk-to-reward ratio | Beginners may confuse IFVG with ordinary gaps |
No. FVG shows an imbalance in the trend's direction; IFVG shows an imbalance when the market retraces or reverses too sharply.
Most traders prefer 1H and 4H charts for clarity. Scalpers prefer using 5M–15M. Higher timeframes produce stronger signals.
If price cleanly closes beyond the far boundary of the inverse FVG and breaks micro structure against your trade, the initial reaction setup is compromised. A full fill alone does not always invalidate it; it's the close and structure shift that matters.
They're similar in both mark imbalances. The difference is that IFVGs are specifically tied to inverse price action, while supply-demand zones are broader.
In conclusion, inverse fair value gaps may sound technical, but at their core, they're about recognising where the market overreacted and left footprints of inefficiency.
The key? Don't treat IFVGs in isolation. Combine them with higher timeframe analysis, BOS, order blocks, and volume for the highest accuracy.
Disclaimer: This material is for general information purposes only and is not intended as (and should not be considered to be) financial, investment or other advice on which reliance should be placed. No opinion given in the material constitutes a recommendation by EBC or the author that any particular investment, security, transaction or investment strategy is suitable for any specific person.
[1] https://www.reuters.com/world/us/updates-tesla-q2-earnings-musk-qa-2025-07-23/
[2] https://finance.yahoo.com/quote/BTC%3DF/history/


World's Best Broker