Published on: 2025-08-28
Updated on: 2026-07-16
A CFD trading strategy is a defined plan for when to open and close a Contract for Difference, how much to risk on each trade, and which market conditions to trade in. It is an agreement to exchange the difference in an asset’s price between the moment you open a position and the moment you close it. You never own the underlying asset. You trade on the price move alone, and you can go long (profit if the price rises) or short (profit if the price falls).
A strategy is not a signal. It is a full plan: entry, exit, position size, and the conditions you will and will not trade.
Holding period is the main variable. Scalping lasts seconds; position trading lasts months. Everything else follows from that.
Leverage cuts both ways. It magnifies gains and losses by the same ratio, so position sizing is the strategy that keeps every other strategy alive.
Costs decide outcomes. Spread and commission hit frequent traders hardest. Overnight financing (swap) hits long holders hardest.
Regulators publish loss data. Across the EU, 74-89 per cent of retail CFD accounts lost money (ESMA, 2018). In Australia, 68 per cent lost in the 2024 financial year (ASIC, 2026). Plan for that reality.
Before the strategies, one worked example fixes the mechanics. Every number below is illustrative.
Suppose a share trades at $10.00, and you buy 1,000 share CFDs. The full position value is $10,000. You do not pay $10,000. Under the retail leverage cap for individual shares (5:1, which means 20 per cent margin), you deposit $2,000 in margin. Your broker finances the rest.
If the price rises 10 per cent to $11.00, your position gains 1,000 x $1.00 = $1,000. On your $2,000 margin, that is a 50 per cent return.
If the price falls 10 per cent to $9.00, you lose $1,000, or 50 per cent of your margin.
A 10 per cent move in the asset became a 50 per cent move in your account. That is leverage. The regulator ASIC publishes similar worked examples in its Moneysmart guidance, and the lesson is consistent: leverage multiplies the percentage outcome in both directions.
Two costs are missing from that clean example, and they are where many plans fail. First, the spread: you buy at the higher ask price and sell at the lower bid price, so the market must move past the spread before you break even. Second, overnight financing: hold the position past the daily cut-off and you pay a small daily charge on the financed portion. Both are covered in full below.
Leverage and margin are the same idea.
Margin is the deposit needed to open and hold a position, shown as a percentage of the full value. Leverage is the ratio of position size to that deposit. They are two ways of stating one number. A 5% margin is 20:1 leverage. About 3.3 per cent margin is 30:1 leverage. Higher leverage means a smaller deposit controls a larger position, and a smaller adverse move can wipe out that deposit. If you are new to these terms, start with the fundamentals of how margin and leverage work in trading.
Scalping means taking many small trades, each lasting seconds to a few minutes, to capture tiny price moves. Scalpers rely on high liquidity and tight spreads, so they focus on major currency pairs and major indices during peak trading hours.
The main risk is cost, not direction. When each target is a few points, the spread and commission on every trade eat a large share of the gain. Slippage and execution speed also matter more here than in any other style. Because positions close within the session, scalping avoids overnight financing entirely. Short holding time does not mean low risk. Leverage still applies to every trade. See the dedicated guide to scalping as a trading method.
Day trading opens and closes all positions within the same trading day, holding for minutes to hours. It suits liquid, active markets and traders who can watch prices during the session.
Day traders live and die by discipline. The common failure is over-trading: taking marginal setups out of boredom, then paying spread and commission on each one. Like scalping, day trading closes before the daily cut-off, so there is no swap charge. Costs are driven by how often you trade. Read more in the day trading strategy guide.
Swing trading holds positions for several days to a few weeks to capture a larger price move, or “swing,” within a trend. It blends technical analysis with some attention to the economic calendar.
Two risks define it. The first is gap risk: markets can jump overnight or over a weekend, opening far from where they closed, past your intended exit. The second is swap. Because positions are held overnight, financing accrues each night, and most brokers apply a higher charge on one day each week to cover the weekend. Build that cost into your profit target before you enter. Swing trading is often the first multi-day style traders learn, and it pairs naturally with swing trading techniques.
Position trading holds for weeks to months, following a long-term trend supported by fundamentals. It is the closest CFD-style investment, but the cost structure is very different.
The decisive factor is cumulative overnight financing. A long CFD held for months pays financing every single night. If the annual financing rate is, say, five per cent, a long index CFD must rise more than five per cent over the year just to cover the carry before any profit is realised. For genuinely long-term exposure, this cost is why many traders consider other instruments. Position trading is viable in CFDs, but only if the expected move clearly exceeds the accumulated financing.
Trend following enters in the direction of an established trend and stays in until the trend shows signs of reversing. The idea is simple: trade with the prevailing direction rather than against it. It can be applied on any timeframe.
Trend following works in clearly trending markets and struggles in choppy, sideways ones, where it produces repeated small losses called whipsaws. The other challenge is giving back open profit at the turn, since a trend follower exits only after the reversal begins. On longer timeframes, remember that financing accrues the whole time you hold.
Breakout trading enters when price moves decisively beyond a defined level of support or resistance, ideally on rising volume. The trader is betting that the break marks the start of a new move.
The primary risk is the false breakout: price pushes past the level, triggers entries, then reverses. A stop-loss order placed on the other side of the level is the standard defence. CFDs suit breakouts because you can go long or short instantly, but fast breaks can bring slippage, so the fill may be worse than the level you saw. Levels and the patterns that produce them are covered in the chart patterns education.
Range trading works when a market moves sideways between a clear floor (support) and ceiling (resistance). The trader buys near support and sells near resistance, repeating until the range breaks.
The risk is the break itself: when price finally leaves the range, a trader positioned for another bounce takes a loss. Cost is also proportionally higher here, because the spread is a larger share of a small in-range move. Range trading needs stable, low-trend conditions and firm exits for when the range ends.
News trading takes positions around scheduled events such as central bank rate decisions, inflation releases, or company earnings. It is a short-term style built on the volatility these events create.
This is the most treacherous style in terms of cost and execution. Around major releases, spreads widen, prices gap, and stop orders can fill far from their set level. The first market reaction can also reverse within minutes. News trading rewards preparation and punishes improvisation. A clear understanding of the economic calendar and key data releases is required for entry.
Hedging opens a CFD position to offset risk in an existing holding rather than to seek new profit. A common example: you hold a share for the long term but expect short-term weakness, so you open a short CFD on the same share. If the price falls, the CFD gain offsets part of the paper loss on your holding.
Hedging is defensive. It does not remove risk, and it does not guarantee protection. It carries its own costs, including financing and any dividend adjustments, and it works only as well as the correlation between the hedge and the holding. Over-hedging, or hedging with a poorly matched instrument, can create a new loss rather than cancel an old one.
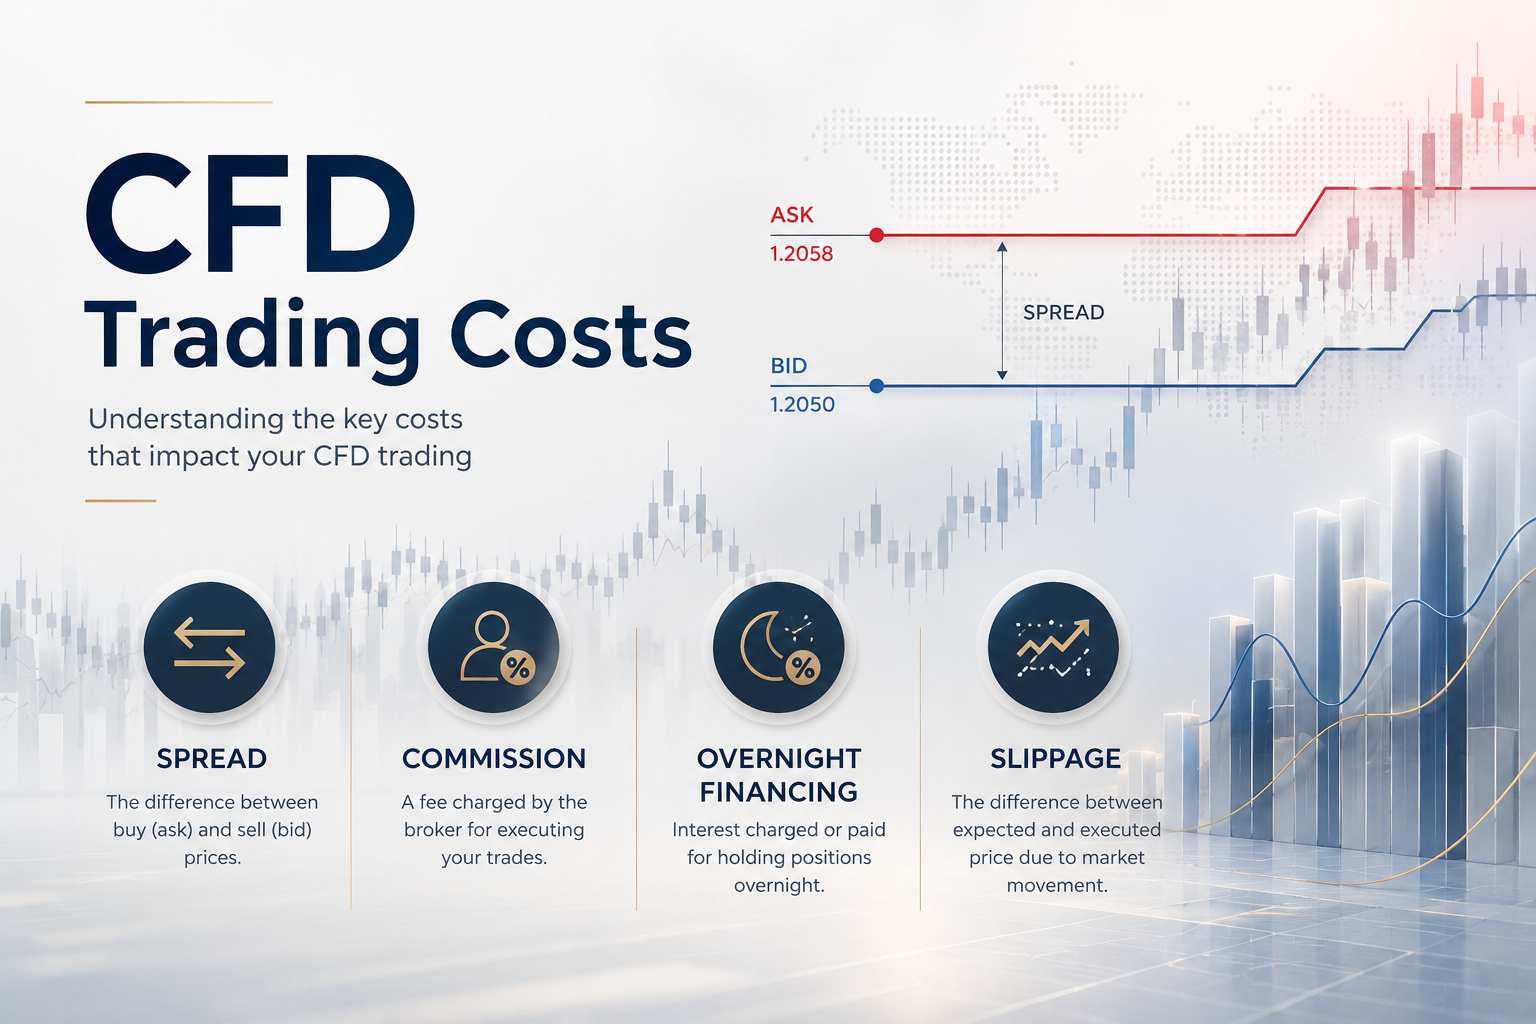
No strategy is complete without its cost. Three charges apply.
Spread. The gap between the buy price and the sell price. You cross it every time you open and close, so it is the base cost of every trade. Scalpers and day traders pay it most often, which is why they trade only tight-spread instruments.
Commission. Some CFDs, especially on shares, carry separate entry and exit commissions. Others price the cost into the spread. Know which model applies to each instrument you trade.
Overnight financing (swap). A daily charge, occasionally a credit, for holding a leveraged position past the daily cut-off. It reflects the cost of financing the borrowed portion of your position. On currency pairs, it also reflects the interest rate difference between the two currencies.
Most brokers apply a triple charge on one day of the week to account for the weekend. Financing is small per night and large over months, which is exactly why it barely touches a day trader and heavily taxes a position trader.
The practical rule: match your instrument to your style. Frequent styles need low spreads. Long-hold styles need to cover the financing costs before they turn a profit.
Risk management is the one part of trading you control completely. Direction is uncertain. Position size is not.
The widely used starting point is the one per cent rule: risk no more than one per cent of your account on any single trade. On a $10,000 account, that is $100 of risk per trade. This is the maximum you accept losing if the stop-loss is hit, not the amount you put into the position.
Position size then follows from your stop distance:
Position size = risk amount / (stop distance x value per unit)
Say your account is $10,000, your risk is one per cent ($100), and your analysis places a stop $0.50 away from your entry on a share CFD worth $1 per point per unit. Your position size is $100 / $0.50 = 200 CFDs. If the stop is hit, you lose $100, exactly one per cent. If your stop needs to sit further away, your position must be smaller to keep the loss at one per cent. The stop defines the size, not the other way around.
Pair this with a risk-reward ratio. If you risk $100 to make $200, your ratio is 1:2. At 1:2, you can be right less than half the time and still come out ahead. Sizing and risk-reward, applied together to every trade, are what let a strategy survive a losing streak. For the full framework, see position sizing and risk-reward in practice.
CFDs are regulated products, and the rules differ by region. The table below sets out the retail framework in several jurisdictions relevant to international traders. Always confirm the current rules with your own regulator, since they are updated over time.
| Regulator (Region) | Retail Leverage on Major FX | Key Retail Protections |
|---|---|---|
| ESMA (European Union) | 30:1 | 50% margin close-out, negative balance protection, and a standardized risk warning (effective 1 August 2018) |
| FCA (United Kingdom) | 30:1 | Same core protections as ESMA, made permanent from 1 August 2019 |
| ASIC (Australia) | 30:1 | Margin close-out, negative balance protection, and an inducement ban (since 29 March 2021; extended to 2027) |
| MAS (Singapore) | Capped for retail (commonly cited at 20:1 on major FX) | Licensed brokers and a Customer Knowledge Assessment before trading; confirm the current leverage cap with MAS |
| FSCA (South Africa) | No fixed ESMA-style cap | Firms offering CFDs as principal require an OTC Derivative Provider (ODP) licence under the Financial Markets Act |
| DFSA & SCA (United Arab Emirates) | Set by the relevant authority | DFSA regulates firms in the DIFC, while the SCA regulates mainland UAE; check which regulator oversees your account |
The international standard behind these regimes comes from IOSCO, whose 2018 report on retail OTC leveraged products set out the common toolkit of leverage limits, margin close-out, negative balance protection, and standardised warnings.
This is the question every honest guide must answer with data, not folklore. Regulators require brokers to publish loss rates, and the published figures are consistent.
In the European Union, national regulators found that 74 to 89 per cent of retail CFD accounts lost money, with average losses per client ranging from about €1,600 to €29,000 (ESMA, 27 March 2018).
In the United Kingdom, the FCA’s own sample found that roughly 82 per cent of clients lost money, with an average loss of £2,200 per account (FCA CP16/40, December 2016).
In Australia, 68 per cent of retail CFD investors lost money in the 2024 financial year, with losses totalling more than A$458 million, including A$73 million in fees (ASIC media release 26-004MR, January 2026). During a five-week period of extreme volatility in early 2020, retail clients of 13 CFD issuers lost a combined A$774 million (ASIC, October 2020).
The reasons are consistent, too: applying leverage without position sizing, holding losers too long, and ignoring costs. The strategies in this guide are the countermeasures. None of them changes the base rate on their own. Discipline applied to them does.
Swing trading is often where beginners start, because it does not require watching the screen all day and gives time to think through each decision. The better answer is that the “best” strategy is the one that matches your available time, your tolerance for risk, and the costs you can bear. A part-time trader and a full-time screen watcher need different plans.
Some traders profit, but regulatory data show that most retail accounts lose money over time (see the figures above). CFDs are high-risk leveraged products. Any realistic plan starts from that fact and focuses on controlling losses, not just chasing gains.
There is no single figure, and account minimums vary. The more useful question is how much you can afford to lose without affecting your finances, since leveraged losses can exceed your initial deposit unless negative balance protection applies in your region.
Risk no more than one per cent of your account on a single trade. On a $5,000 account, your loss per trade is capped at $50. It keeps any single trade or a run of losses from ending your account.
Buy 1,000 share CFDs at $10 (a $10,000 position) with $2,000 margin at 5:1 leverage. A rise to $11 gives a $1,000 gain, 50 per cent on your margin. A fall to $9 gives a $1,000 loss, 50 per cent on your margin, before spread and financing. The full worked version is above.
CFD trading involves speculation, but it differs from gambling in that outcomes can be shaped by analysis, position sizing, and risk control. Without those controls, trading on leverage can resemble gambling in its results. The method you apply is what separates the two.
Start from your holding period, because it sets everything else. If you can watch the screen and accept high cost sensitivity, the short-term styles (scalping, day trading, news trading) are open to you. If you cannot, the multi-day styles (swing, position, trend following) fit better, provided you plan for financing and gap risk.
Match the instrument to the style, size every trade to the one per cent rule, and clear your costs before you count profit.
One final point worth holding onto: the strategy you pick matters less than the consistency with which you size and exit. The regulator data is blunt about how most accounts end. The traders who last are not the ones with the cleverest entries. They are the ones who lose small when they are wrong. Build the plan around that, and you can compare CFD accounts and instruments on the details that actually affect your trading, such as spreads and available markets.
Disclaimer: This material is for general information purposes only and is not intended as (and should not be considered to be) financial, investment, or other advice on which reliance should be placed. No opinion given in the material constitutes a recommendation by the author that any particular investment, security, transaction or investment strategy is suitable for any specific person.