Published on: 2025-07-31
When price action accelerates unsustainably, it often precedes sharp reversals. The Bump and Run Reversal (BARR) pattern, first documented by chart-pattern expert Thomas Bulkowski, offers traders a unique way to spot these reversals.
By identifying when a trend suddenly "bumps" upward (or downward) beyond its lead-in pace and then "runs" back through the trend line, BARR provides a high-probability reversal signal.
In this guide, we'll define the pattern, explain its three phases, and walk through how to trade it strategically across markets.

The Bump and Run Reversal is a structured reversal pattern that occurs after excessive speculation drives the price too far, too fast. Originally named the Bump and Run Formation (BARF), it was later renamed for market suitability. It consists of:
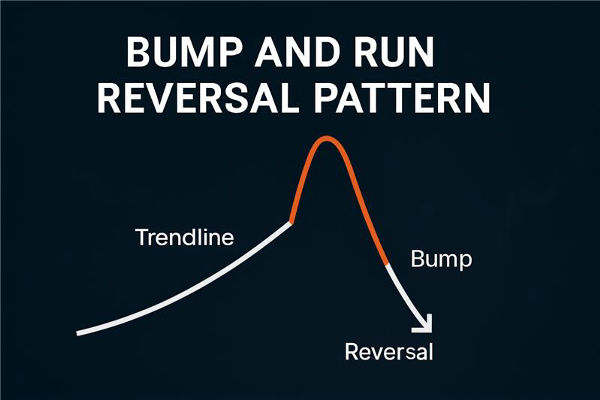
A Lead-In Phase, where the prevailing trend develops gradually.
A Bump Phase, where price accelerates sharply beyond normal range.
A Run Phase, where the price breaks the trendline and reverses.
Bulkowski's research shows this pattern ranks among the most effective reversal chart patterns in multiple studies. Traders use it across equities, forex, commodities, and indices.
Bearish Bump & Run (Top): Occurs after an uptrend, leading to a sharp downfall when the trendline breaks.
Bullish Bump & Run (Bottom): Occurs after a downtrend; price drops sharply before rebounding and breaking above the trendline.

Lead-In Phase
It is the initial trend: Up for a bearish reversal (bump & run top), or down for a bullish reversal (bump & run bottom). Trendlines here are moderate, typically between 30° and 45° incline, and trade volumes remain steady or low.
Bump Phase
Here, price accelerates sharply, steeper than in the lead-in, forming the "bump." A valid bump must be at least 50% steeper than the lead-in, and the peak must rise at least twice as high above the trendline compared to previous lead-in highs. Volume often spikes as the bump forms.
Run Phase
Following the bump, price retreats toward and breaks the original trendline, confirming a reversal. The "run" phase begins at the breakout and triggers the trade opportunity. A retest of the broken trendline may occur.
Trendline Angles
Identify a lead-in trendline between 30–45° and confirm a bump of 45–60° steepness thereafter.
Size Ratio Check
Evaluate the vertical distance from the peak of the bump to the lead-in trendline (S2) and from the pre-bump high to the trendline (S1). The bump (S2) needs to be double the size of S1.
Volume Confirmation
Volume should spike during the bump, indicating speculative acceleration, but often decline during the lead-in. High volume during breakouts confirms validity.
Pattern Completion: Trendline Break
A confirmed breakout through the lead-in trendline signals that the "run" phase and price reversal have started.

Entry Point
For bearish reversal: Short the asset upon break of the upward trendline after the bump.
For bullish reversal: Buy or go long after a break of the downward trendline.
Certain traders anticipate a retest of the trendline following a breakout, confirming with a reversal bar before entering.
Stop-Loss Placement
Place a stop-loss around the midpoint between the bump's peak and the breakout point. This balances risk control with allowance for volatility.
Profit Targeting
Define targets using swing support/resistance, Fibonacci levels, or follow price action continuation. Some traders hold until trend structure flips or reversal patterns appear.
Risk-Reward Considerations
Risk-to-reward often favours traders, as stops are tight and targets can be multiples of risk size. Traders typically maintain at least a 2R ratio.
Advantages
Clear structure and confirmation criteria
High probability signal backed by research
Favourable risk-reward when the setup conforms
Versatile across instruments and timeframes (daily/weekly/intraday)
Early warning of speculative excess and institutional behaviour
Limitations
Rare and thus hard to find frequently
Subjective identification (trendline angles, timing)
Prone to false breakouts—requires volume confirmation
Slow formation—unsuited for scalability in fast intraday strategies
Needs additional confirmation via indicators like ADX or RSI for reliability
Thomas Bulkowski's original research on BARR showed a success rate of around 68%, rising to 75–90% when confirmed with volume and metrics like ADX. He emphasised the importance of evaluating bump sizes and verifying trendline alignment.
His results show:
Daily and weekly charts yield the most reliable setups.
Intraday charts can display BARR but require more discipline and precision.
Works well in equities, forex, commodities, and crypto, particularly when extended trends show sudden speculative impulses.
Additional Confirmation tools include:
Average Directional Index (ADX): Confirms trend strength and break validity.
RSI or MACD divergences: Support price exhaustion during bump and validate reversal.
Fibonacci retracements: Guide post-break targets and locations for retests.
Volume indicators: Ensure bump-phase volume spikes and breakout volume
In conclusion, the Bump and Run Reversal pattern is a nuanced yet powerful tool for spotting trend reversals driven by speculative excess. With well-defined phases and a strong evidence base from Bulkowski's research, it offers traders a disciplined approach to capitalising on reversals across markets.
While rare, the pattern's clarity, confirmation criteria, and risk-defined structure make it a high-probability setup when used correctly. Combine it with volume analysis and technical indicators to maximise reliability, and always maintain disciplined risk control.
Disclaimer: This material is for general information purposes only and is not intended as (and should not be considered to be) financial, investment or other advice on which reliance should be placed. No opinion given in the material constitutes a recommendation by EBC or the author that any particular investment, security, transaction or investment strategy is suitable for any specific person.