Published on: 2025-07-31
Updated on: 2025-07-31
In the realm of commodity trading, gold (XAU/USD) remains one of the most actively analysed instruments due to its dual role as both a financial hedge and a momentum-driven asset. With price action often governed by global macroeconomic variables, technical patterns, and sentiment shifts, understanding the nuances of the XAU/USD chart is essential for short- and medium-term traders. This article offers a deep dive into the technical dynamics of the gold chart, broken down into six core areas that influence decision-making on a daily basis.

Support and resistance levels form the bedrock of technical chart reading. In the case of XAU/USD, traders consistently monitor certain price levels due to their historical relevance and psychological significance.
Support levels: Key demand zones in recent months have formed near $3.260 and $3.254. where price has repeatedly rebounded. These areas tend to coincide with former breakout points or Fibonacci retracement zones (38.2%–61.8%), offering buying interest when prices decline rapidly.
Resistance levels: The upper threshold is often tested in the region of $3.345 to $3.360. where upward momentum has previously stalled. Additionally, the $3.300–$3.310 range has served as both support and resistance depending on the direction of price action.
Confluence zones: Traders should be vigilant when support/resistance overlaps with trendlines, moving averages, or pivot levels, as these intersections amplify the likelihood of a reaction.
Establishing these levels on your chart enables effective entry, stop-loss, and take-profit positioning, especially during high-volatility sessions influenced by economic events.
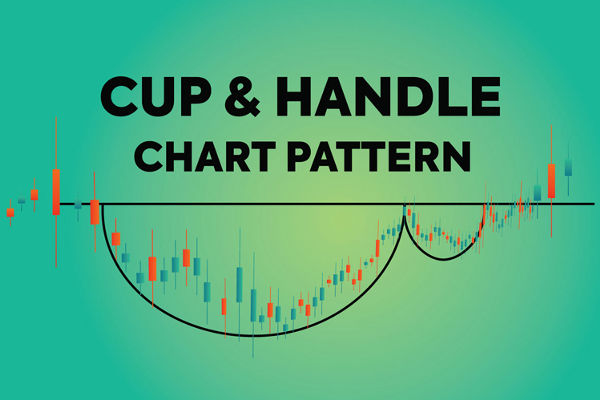
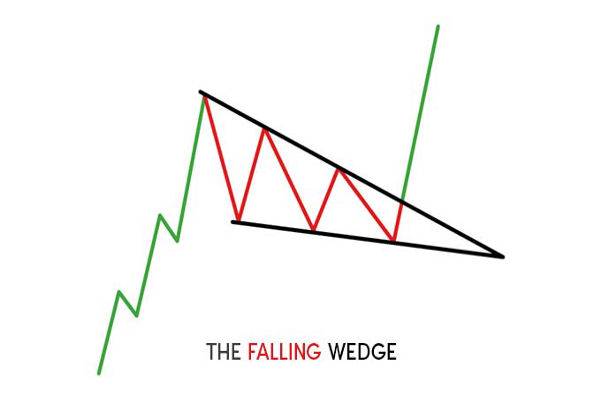
Price action in XAU/USD frequently presents well-structured chart patterns, offering cues for breakout trades or potential reversals.
Bullish patterns: Ascending triangles and bull flags have led to strong breakouts, especially when backed by increased volume. A recent example occurred when price broke above $3.280 following a consolidation pattern lasting several days.
Bearish patterns: Double tops or rising wedges near resistance zones have often preceded corrective moves. One such pattern formed at $3.360. triggering a retreat back to $3.300.
Breakout strategies: Traders looking to capitalise on pattern breakouts should focus on confirmation candles (e.g., bullish engulfing or outside bars), ideally accompanied by a surge in volume or momentum divergence for confirmation.
Keeping these formations in focus can help traders anticipate the next impulsive leg or catch traps where false breakouts seek to mislead the unwary.
Understanding the prevailing trend is critical in aligning your trades with market momentum rather than against it.
Short-term trends: On the 1-hour and 4-hour charts, XAU/USD has displayed frequent ascending channels, suggesting a series of higher highs and higher lows—ideal for swing traders using trend-following systems.
 Medium-term trends: The daily chart often reveals broader trend direction. When gold broke through $3.180 earlier this year, it shifted into a bullish medium-term trend that persisted for weeks, until encountering resistance near all-time highs.
 Trendline validation: Draw trendlines connecting the recent swing lows (in uptrends) or swing highs (in downtrends), and monitor how price reacts upon testing these boundaries. Channel breakdowns often lead to explosive directional moves.
Establishing trend bias allows for entry filtering—only taking longs in an uptrend or shorts in a downtrend, significantly improving trade probabilities.
Momentum oscillators offer insight into strength, weakness, and potential reversals, complementing price-based analysis.
RSI (Relative Strength Index): Often provides early warning signs of exhaustion. Readings above 70 indicate overbought conditions, while sub-30 signals oversold status. Traders watch for RSI divergence, where price makes a new high but RSI fails to follow.
MACD (Moving Average Convergence Divergence): A reliable signal generator for trend strength and changes. A bullish MACD crossover near a support zone can suggest an ideal entry point.
Stochastic Oscillator: Particularly useful in ranging markets. Fast stochastic crossovers below 20 or above 80 suggest imminent reversal pressure.
Awesome Oscillator (AO): Highlights momentum shifts via histogram colour changes. Bullish momentum is signalled when AO rises above the zero line, especially after a bullish divergence setup.
Traders use these indicators in tandem with price action to confirm trade entries, filter false signals, or exit trades when momentum wanes.
Moving averages (MAs) serve as dynamic support/resistance levels and help smooth out market noise.
Short-term MAs (MA5. MA10. MA20): Ideal for scalping or quick intraday trades. A cross of MA5 over MA20. combined with price closing above both, usually implies building bullish momentum.
Medium/long-term MAs (MA50. MA100): These offer a broader trend perspective. On the daily chart, when price is above the MA50 and MA100. it's a signal of bullish market control.
Golden Cross / Death Cross: When the MA50 crosses above MA200 (golden cross), or below (death cross), it often confirms a sustained directional shift. Such signals attract large trading volumes and institutional interest.
MAs also aid in stop-loss placement; for instance, trailing a stop below the MA20 during strong upward trends is a common technique.
Volume analysis, though often underutilised in forex/CFDs, can be a powerful supplementary tool when interpreted correctly.
Volume spikes: Sudden increases in volume during a breakout often indicate institutional participation or sustained follow-through potential. Lack of volume post-breakout suggests the move may be unsustainable.
Pivot points: Widely used for intraday analysis. Traders use daily pivot levels (R1. R2. S1. S2) as profit-taking or entry zones. For instance, if price opens above the daily pivot and sustains, traders anticipate a move toward R1 or R2.
Fibonacci pivot levels: These incorporate Fibonacci ratios into support/resistance projections, offering enhanced sensitivity. They're particularly effective on gold due to its reactive behaviour to fib zones.
Incorporating volume and pivot analysis into your trading framework allows for better timing and more precise order placement—key components of intraday and swing strategies.
Trading the XAU/USD chart successfully requires more than just chart reading—it demands a disciplined approach, constant awareness of the macroeconomic backdrop, and clear risk management. By combining key support/resistance levels, breakout patterns, trend structures, and a robust toolkit of indicators, traders can dramatically enhance their edge in the market.
Remember, no single signal is sufficient in isolation. The power lies in confluence—where multiple indicators and price behaviours align. In the world of gold trading, where volatility is both a friend and a foe, this alignment becomes the trader's most valuable asset.
Disclaimer: This material is for general information purposes only and is not intended as (and should not be considered to be) financial, investment or other advice on which reliance should be placed. No opinion given in the material constitutes a recommendation by EBC or the author that any particular investment, security, transaction or investment strategy is suitable for any specific person.