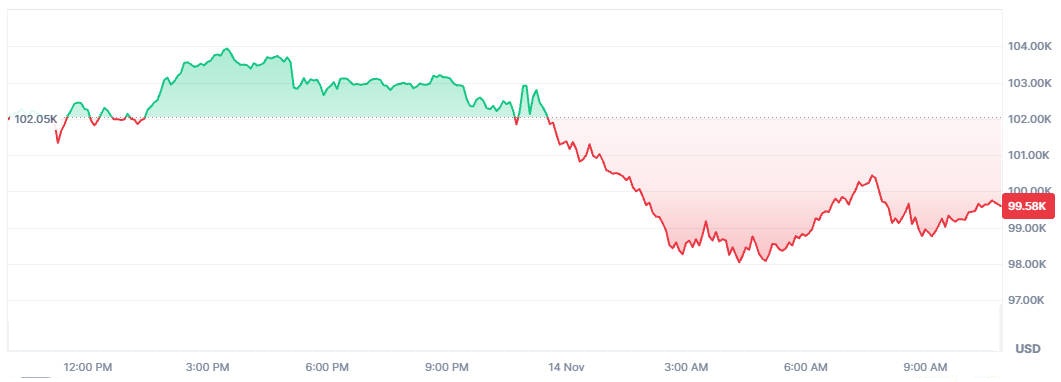
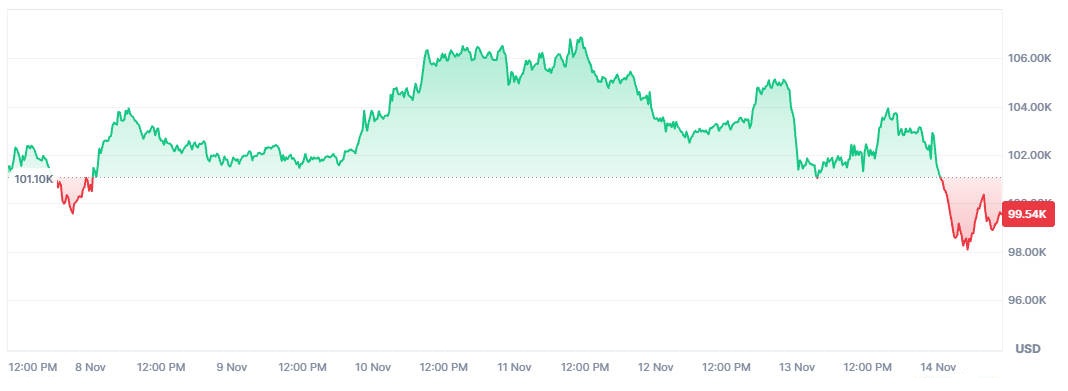
Bitcoin's price fell back below the $100.000 mark this week, printing intraday lows near $98.000 to $99.000 and marking the lowest levels seen in six months.


Significant selling from long term holders, large-scale liquidations in futures markets and a temporary withdrawal of institutional appetite are the main drivers.
The immediate outlook depends on whether inflows into spot products and on-chain accumulation resume.
A Short Timeline Of The BTC Price Move

Markets opened the week with positive momentum following the October highs.
A sequence of forced liquidations and weaker market depth caused rapid intraday declines. Large sellers among long term holders increased realised supply.[1]
Bitcoin briefly traded below $100.000 on several occasions and reached roughly $99 on the day of the six month low. Price has since traded in the low hundred thousands while volatility remains elevated.
Primary Drivers Behind The BTC Price Move
1. Long Term Holder Selling
Recent on-chain analyses show a material rise in coins moving from long term wallets to exchanges. This behaviour has converted previously dormant supply into available market liquidity, which has increased selling pressure.[2]
2. Leverage And Liquidations
Futures and perpetual markets experienced concentrated liquidations shortly before the sharp price drops. High leverage amplified downward moves and forced further selling from margin calls, which increased volatility and depressed short term prices.
3. Institutional Demand And ETF Flows
Spot Bitcoin ETF flows recently shifted from consistent inflows to intermittent outflows and then small inflows. That rotation reduced a steady buyer base and left prices vulnerable when leveraged sellers dominated order books.[3]
4. Macro And Surface Level Risk Appetite
Tighter liquidity conditions in traditional markets, concerns over macro data and risk aversion across asset classes reduced investors' willingness to hold speculative positions. This environment increased correlation between Bitcoin and wider risk markets.
Where The BTC Price Stands Now

The technical structure shows three clear zones to watch.
The first zone is immediate support near the $98.000 to $100.000 area, where recent intraday lows appeared.
The second zone of interest is the mid $80.000s to low $90.000s, which would represent a deeper corrective move.
The third zone is long term support and the prior consolidation area around $70.000 to $80.000. which would indicate a materially changed market regime if tested.
Traders should monitor the weekly moving averages and the relative strength index for signs of exhaustion or renewed momentum. A sustained move back above short term resistance, combined with recovering ETF inflows and declining funding stress, would increase the probability of a durable recovery.
On-Chain Signals That Confirm Or Contradict The Price Move
On-chain indicators present a mixed picture. Exchange inflows spiked during the sell-off, signalling short term supply pressure.
At the same time, spot ETF data and some large wallet accumulations have shown intermittent buying, suggesting a base of demand remains. Net movement of coins from long term holders to exchanges is an important red flag, while a reversal of that trend would be constructive.
| Metric |
Recent Reading |
Interpretation |
| Long Term Holder Sales (30 days) |
Elevated relative to prior months |
Increased selling pressure from a normally patient cohort. |
| Exchange Net Flows |
Positive during sell off |
Short term supply available for market buyers. |
| Spot ETF Net Flows (recent week) |
Small net inflows after prior outflows |
Institutional demand appears intermittent, not yet sustained. |
Who Is Buying And Who Is Selling Bitcoin

Retail participants exhibited dip buying in many exchanges following sharp intraday declines. Professional desks noted that institutional allocation remained cautious, with some investors reducing speculative exposure and others waiting for clearer macro signals.
Option market positioning shows elevated demand for downside protection, which increases the cost of hedging and can amplify price moves in times of stress.
Short, Medium And Long Term Outlook For BTC Price
| Scenario |
Description |
What To Watch |
| Bear |
Continued selling from long term holders and repeated leverage flushes push price into a deeper correction. |
Rising exchange reserves, negative ETF flows, and major macro disruptions. |
| Base |
Consolidation around current levels with episodic volatility and eventual stabilisation as institutional flows resume. |
Balanced exchange flows, stabilising on-chain accumulation, and improving macro liquidity. |
| Bull |
Renewed, sustained inflows into spot products and an improvement in risk appetite drive a recovery toward recent highs. |
Strong daily ETF inflows and falling liquidation events. |
Implications For Related Markets And Investment Strategies
A weak BTC price affects crypto equities, particularly miners and exchange stocks, because their revenues and trading volumes correlate with Bitcoin performance. For multi asset investors, increased crypto volatility can change risk budgeting and rebalancing behaviour.
Traders should consider reducing leverage, using protective options, and monitoring funding rates. Long term investors who favour dollar cost averaging may use the recent sell off to add gradually, subject to individual risk tolerance.
Key BTC Price Metrics This Week
| Item |
Value |
| Approximate Intraday Low This Week |
USD 98,300. |
| Typical Trading Range This Week |
USD 98,000 to USD 106,000. |
| Recent 30 Day Long Term Holder Behaviour |
Elevated selling compared with earlier months. |
| Recent ETF Activity |
Intermittent inflows after a period of net redemptions. |
Frequently Asked Qusetions
Q1: Why Did The BTC Price Drop Below $100.000?
Multiple factors combined. Forced liquidations in derivatives, increased selling from long term holders and weaker short term institutional demand created supply pressure that pushed price below the psychological $100.000 mark.
Q2: Is This A Buying Opportunity For Long Term Investors?
The decision depends on individual risk tolerance and investment horizon. Some long term investors view the dip as an opportunity to accumulate gradually while others will wait for clearer macro and on-chain signs of a durable recovery.
Q3: Will The BTC Price Fall Further?
Further declines are possible if long term holders continue selling or if another large liquidation event occurs. Key indicators to watch include exchange reserves, funding rates and ETF flow trends.
Q4: Which Indicators Should I Watch For A Reversal In BTC Price?
Monitor spot ETF net inflows, exchange flow reversals, reduced liquidation events and improving technical momentum on the weekly chart to signal a possible trend reversal.
Q5: How Should Traders Manage Risk While BTC Price Is Volatile?
Traders should consider reducing leverage, sizing positions conservatively, and using options or stop orders for downside protection while monitoring funding rates and order book depth.
Conclusion
The recent drop in the BTC price to the high ninety thousands and the six month low reflects a confluence of technical and fundamental pressures. Selling from long term holders converted latent supply into marketable supply.
Leverage-induced liquidations amplified the move while institutional flows remain intermittent. Market participants should monitor ETF flows, exchange reserves and funding rates for clear evidence of a regime change. Those who intend to invest should adopt a plan that matches their time horizon and risk tolerance.
Sources:
[1]https://beincrypto.com/why-bitcoin-price-dropped-again/
[2]https://www.marketwatch.com/story/bitcoin-sinks-to-a-6-month-low-deepening-its-bear-market-rout-as-long-term-holders-step-up-selling-9d122a90
[3]https://finance.yahoo.com/news/bitcoin-etf-outflows-red-flag-201019342.html
Disclaimer: This material is for general information purposes only and is not intended as (and should not be considered to be) financial, investment or other advice on which reliance should be placed. No opinion given in the material constitutes a recommendation by EBC or the author that any particular investment, security, transaction or investment strategy is suitable for any specific person.


