Published on: 2025-04-18
Updated on: 2025-10-22
Price alone tells only part of the story. A stock or crypto may surge on low volume, signaling weak participation that could collapse at any moment.
By combining price changes with trading volume, VPT helps answer a critical question: Are buyers and sellers actively supporting the trend, or is it a hollow move likely to reverse?

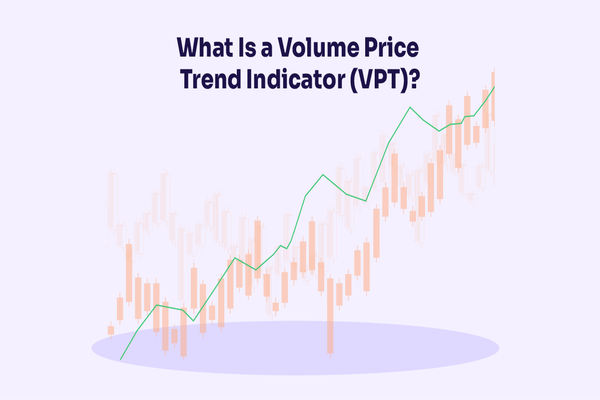
The VPT is a cumulative indicator that weighs price changes by volume, showing whether price moves are supported by meaningful buying or selling activity.
Unlike simpler volume metrics, it accounts for the magnitude of price change, making it a reliable trend confirmation tool.
The VPT is calculated iteratively using the following formula:
VPT = Previous VPT + Volume x (Today’s Closing Price – Previous Closing Price) / Previous Closing Price
Breaking It Down:
Previous VPT: The cumulative value from the day before.
Volume × Price Change %: We weight today’s volume by the percentage price change.
Direction: Positive if the price increased, negative if it decreased.
Tip: The VPT line rises when strong buying pressure accompanies price increases and falls when selling pressure accompanies price decreases.
The VPT provides four primary signals for traders and analysts:
Rising VPT with rising prices confirms a strong uptrend.
Falling VPT with falling prices confirms a strong downtrend.
Bullish Divergence: Price makes a lower low, but VPT forms a higher low, and selling momentum is weakening.
Bearish Divergence: Price makes a higher high, but VPT forms a lower high, buying pressure is fading.
Using a moving average of VPT as a signal line can highlight entry/exit points.
A VPT cross above its signal line can signal a buy; a cross below can signal an exit or short.
A sharp VPT increase alongside a price breakout confirms strong market conviction, reducing the chance of a false breakout.
The VPT offers a valuable weighting mechanism, making it superior to simpler volume metrics. However, its cumulative nature presents inherent drawbacks in certain market conditions.
| Strengths | Limitations |
|---|---|
| Confirms trends with volume-weighted evidence | Can lag in highly volatile markets |
| Highlights divergences for early reversal signals | Signals may mislead in illiquid markets |
| Confirms high-conviction breakouts | Works best in combination with other indicators |
Analysts must weigh these operational strengths against the indicator's core limitations before integrating it into a primary signal-generation strategy.
The table below summarizes VPT suitability across major markets and highlights key considerations for timeframe and liquidity.
| Market/Asset | Suitability | Notes |
|---|---|---|
| Stocks | High | Large-cap, liquid equities; best on daily/weekly charts |
| Forex | Moderate | Tick volume proxy; major pairs more reliable |
| Commodities | High | Futures with strong daily turnover (gold, crude) |
| Cryptocurrencies | Moderate–High | BTC, ETH reliable; low-cap coins may produce noise |
Not all markets react the same way to the Volume Price Trend. The indicator performs best where volume data is reliable and liquidity is strong.
Understanding which assets produce meaningful VPT signals and which may generate noise helps traders apply the tool more effectively and avoid false signals.
A large-cap stock, $XYZ, had been trading between $50 and $52 for several weeks, repeatedly hitting resistance at $52. One day, the price closed at $53, breaking above this key level.
While the breakout suggested a potential uptrend, price action alone wasn’t enough to confirm its strength. Using VPT confirmation, traders could confidently enter long positions after the breakout, with stop-losses placed just below $52.

Integrate: Combine the VPT with trend-following indicators like Moving Averages or other momentum oscillators for higher-probability confirmation.
Validate: Use the VPT primarily to validate trend continuations or high-volume breakouts.
Prioritize Divergence: Pay acute attention to divergences between the price and the VPT as these are typically the earliest warning signs of a shift in market control.
Manage Risk: Always utilize disciplined risk controls, such as strict stop-loss orders, especially when relying on cumulative momentum indicators that can lag dynamic price action.
To maximize VPT’s effectiveness, traders often combine it with:
Moving Averages: Smooth price trends, highlight signal line crossovers.
RSI (Relative Strength Index): Detect overbought/oversold conditions alongside VPT divergences.
MACD (Moving Average Convergence Divergence): Confirms momentum shifts seen in VPT.
This layered approach increases signal reliability and reduces false positives.
If price jumps but VPT remains flat or minimally increases, the breakout may lack conviction. True breakouts show steep VPT acceleration.
Mechanically, yes, but it’s more reliable on longer timeframes (Daily/Weekly) where volume fluctuations are less erratic.
It signals a low-volume rally, meaning momentum is weak and few new participants are driving the price.
The Volume Price Trend indicator is a versatile and insightful tool for traders seeking to quantify the true strength behind price movements.
By weighting volume to price change, the VPT provides a nuanced, clear view of momentum, helping to confirm trends, spot hidden divergences, and sharpen the timing of market entries and exits.
For optimal analytical outcomes, always use the VPT in conjunction with other established technical analysis tools and robust risk management practices.
Disclaimer: This material is for general information purposes only and is not intended as (and should not be considered to be) financial, investment or other advice on which reliance should be placed. No opinion given in the material constitutes a recommendation by EBC or the author that any particular investment, security, transaction or investment strategy is suitable for any specific person.