Most traders tend to rely on pattern analysis or Fibonacci levels to anticipate potential price points.
By replicating past bars and analysing price behaviour using volume, you can achieve far more granular forecasts.
Pattern analysis usually gives a broad view of the likely direction; replicating bars allows precision down to individual bars.
Fibonacci typically yields only specific retracement levels such as 38.2% and 61.8%, whereas volume-based analysis can pinpoint order zones and reveal more exact areas of support and resistance.
TradingView's forecasting and measuring tools make these techniques possible.
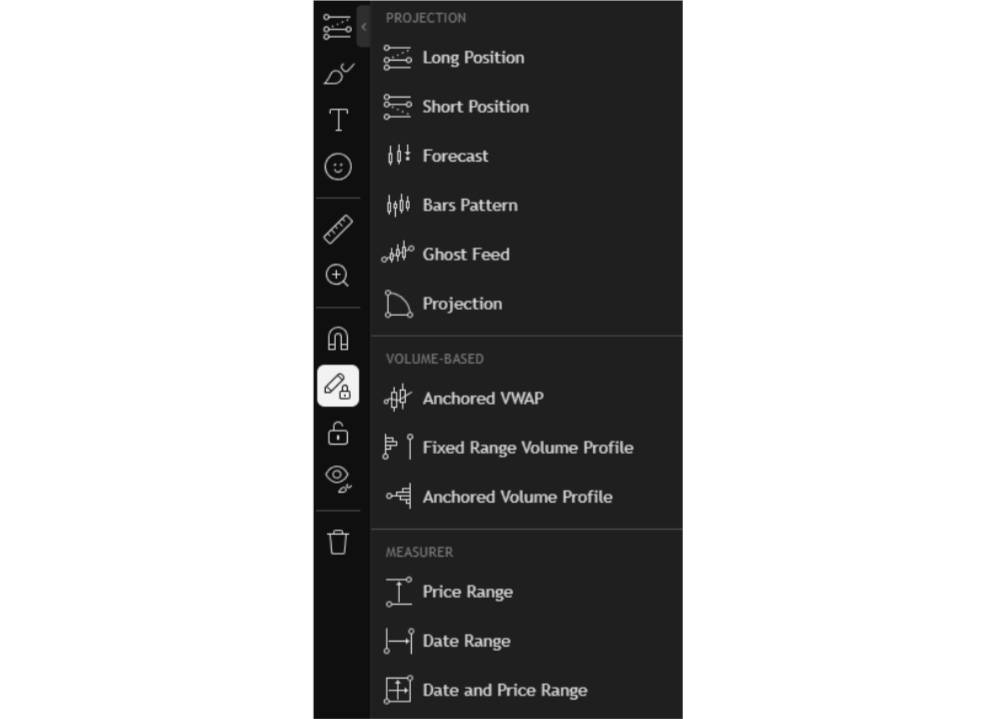
The tools are organised into three main modules: Projection tools, Volume-Based tools, and Measurers.
1. Projection tools
Projection tools mainly refer to fan-style instruments used in technical analysis. Their principle is angle-based: they help predict likely support and resistance and can even indicate reversal structures. There are six tools in total.
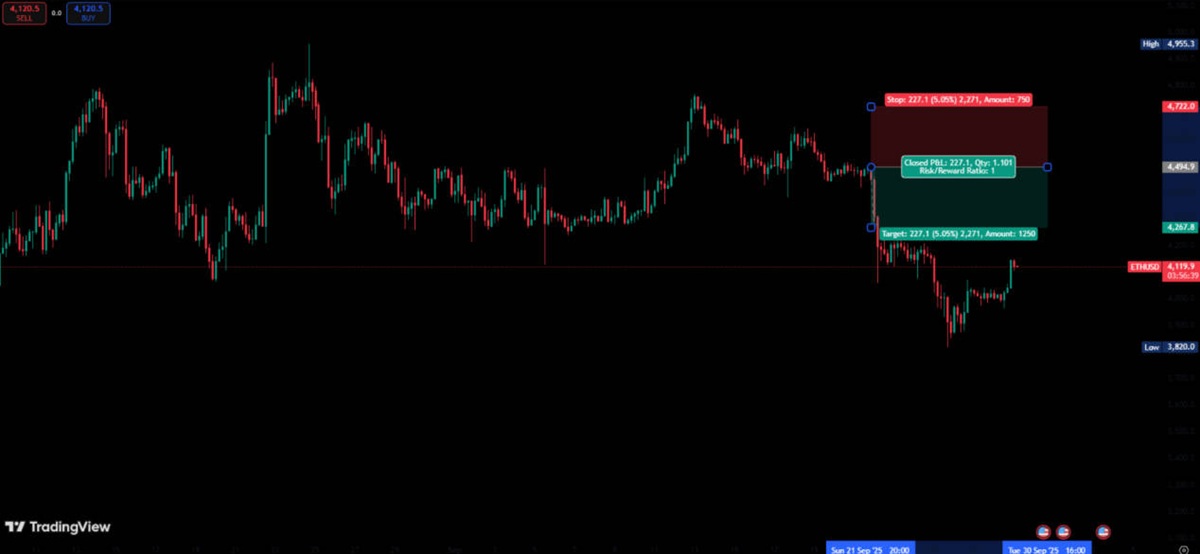
1) Long Position
If you are bullish on the current move, select Long Position. Click the prospective entry point and the chart will mark suggested take-profit and stop-loss levels.
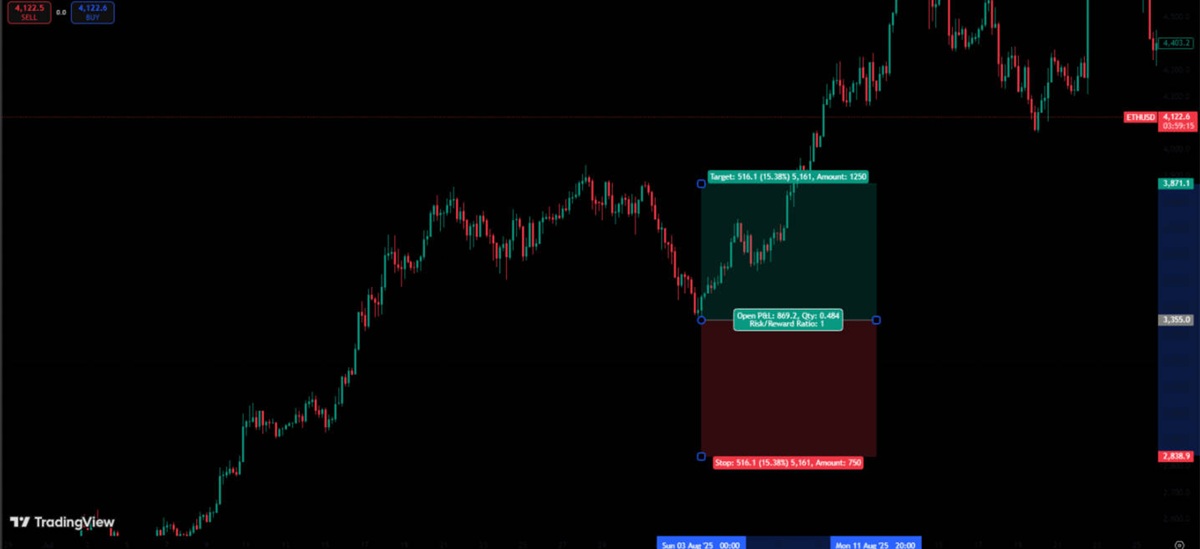
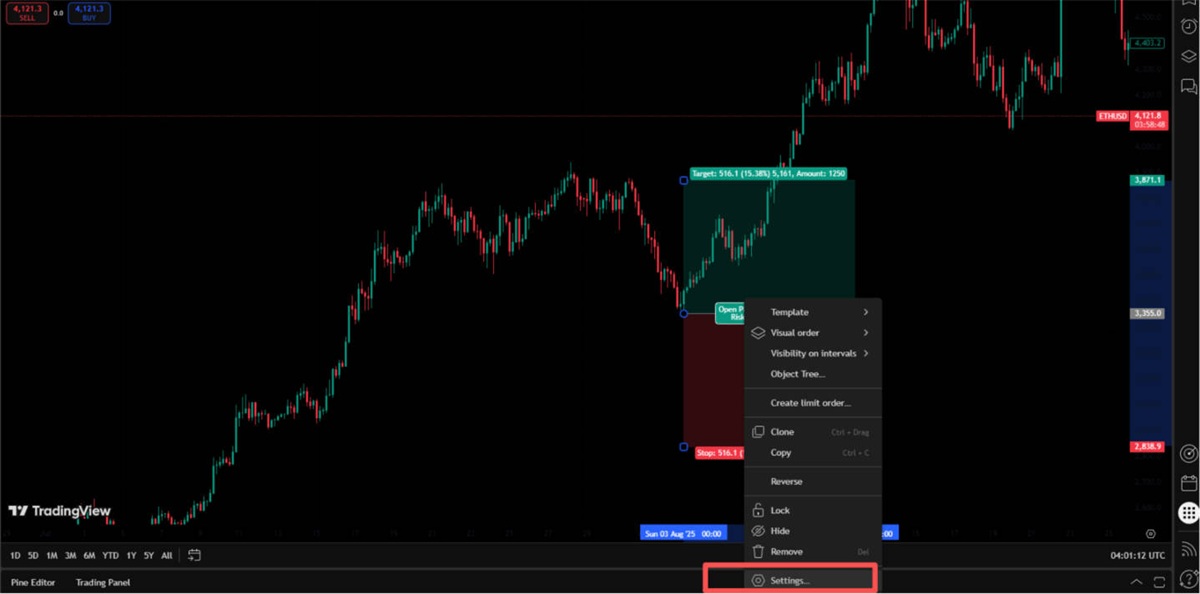
Right-click the red/green zone generated by the indicator to open the settings.
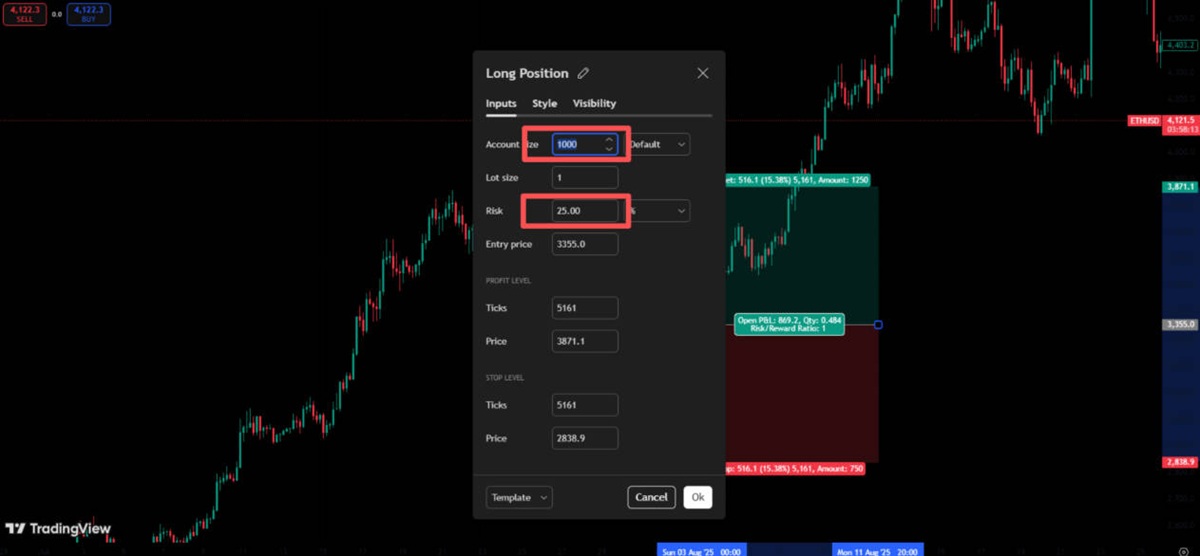
You can enter your account size and set a risk level. The risk level is calculated as profit or loss ÷ account size. For example, with a default risk of 25% and an account of $1.000. the take-profit marker will be placed at $1.250 and the stop-loss at $750. making the target levels instantly clear.
2) Short Position
Short Position works in the opposite way. If you are bearish, activate Short Position, set the risk level, and the tool will show the implied take-profit and stop-loss price levels.
3) Forecast
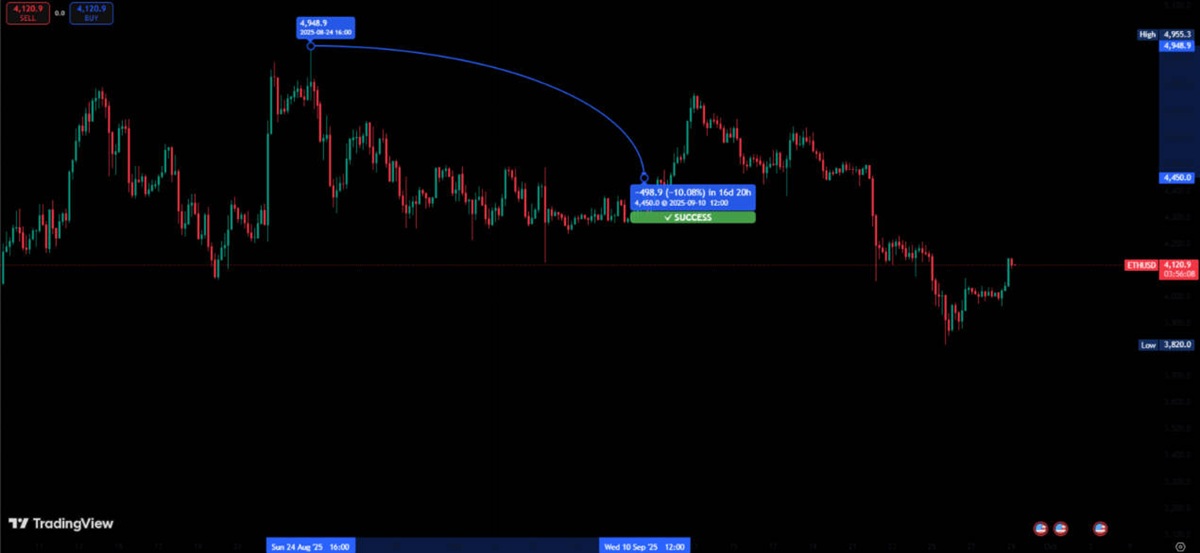
Forecast is a highly useful drawing tool for defining the expected duration of a trade. By extending the forecast line, the tool will, over time, automatically tag the forecast as "successful" or "unsuccessful".
4) Bars Pattern (Replicate Bars)
Bars Pattern is a refined forecasting method.
For example, you might locate a past price sequence that closely resembles the current move and choose Bars Pattern to replicate it.
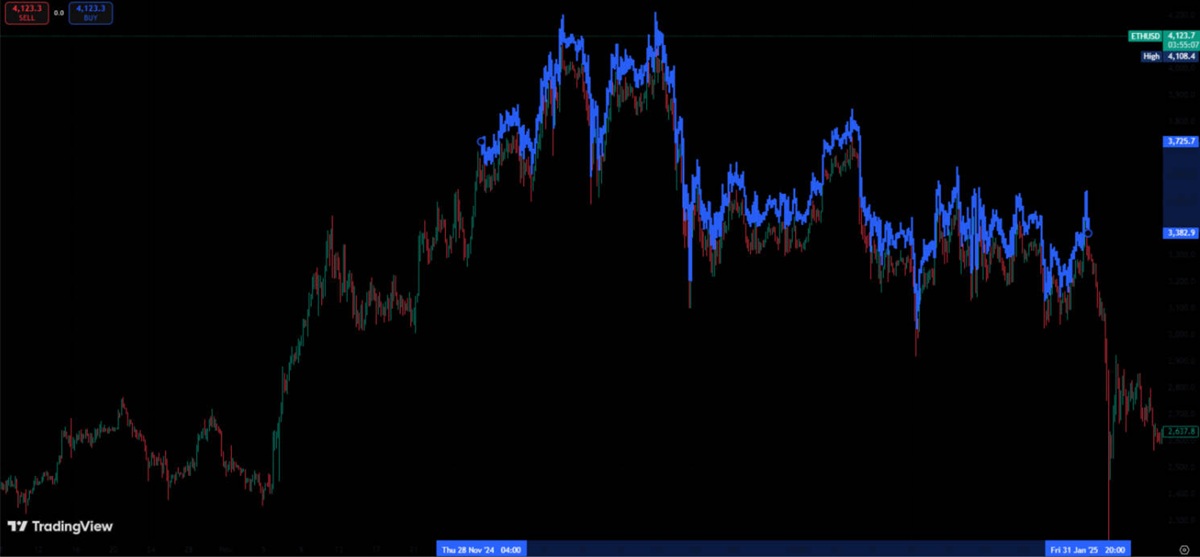
By fitting the copied bars to the present price action, you can infer likely future moves from historical behaviour.
5) Ghost Feed (Simulated Bars)
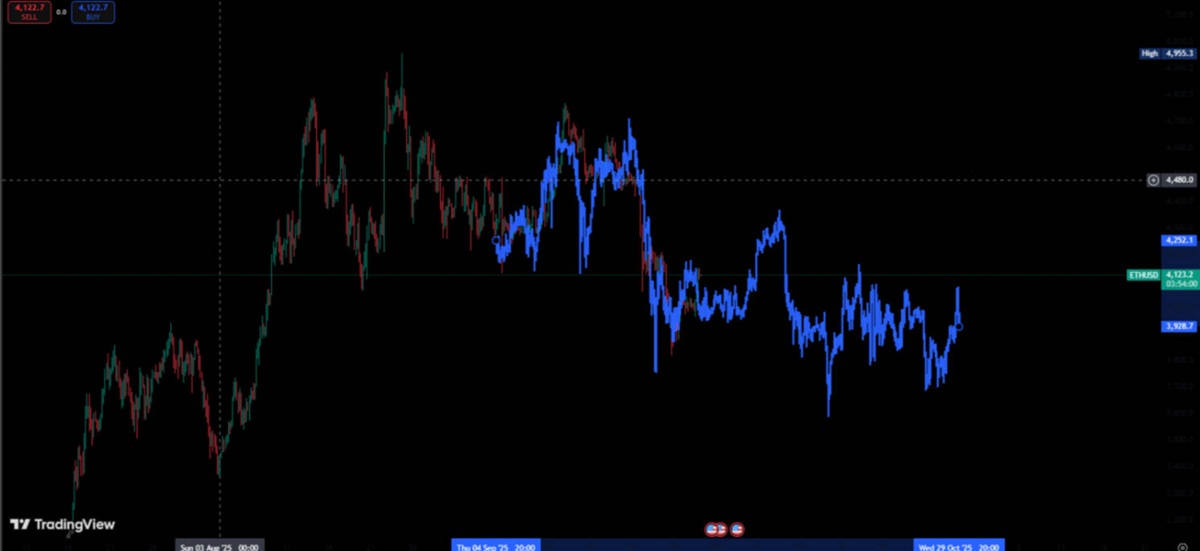
Ghost Feed is a special drawing tool that differs from ordinary line tools: while drawing, it auto-generates a sequence of bars to provide a more tangible visual forecast.
When forthcoming price action closely matches the simulated bars, the forecast’s credibility increases and the simulation can help fine-tune entry and exit decisions.
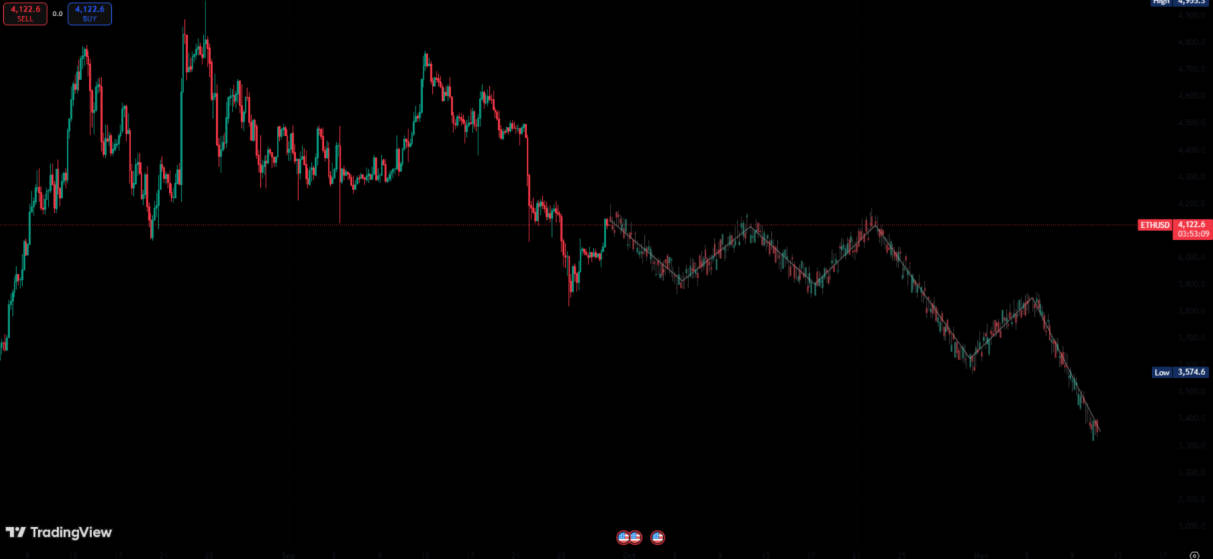
6) Projection (Fan)
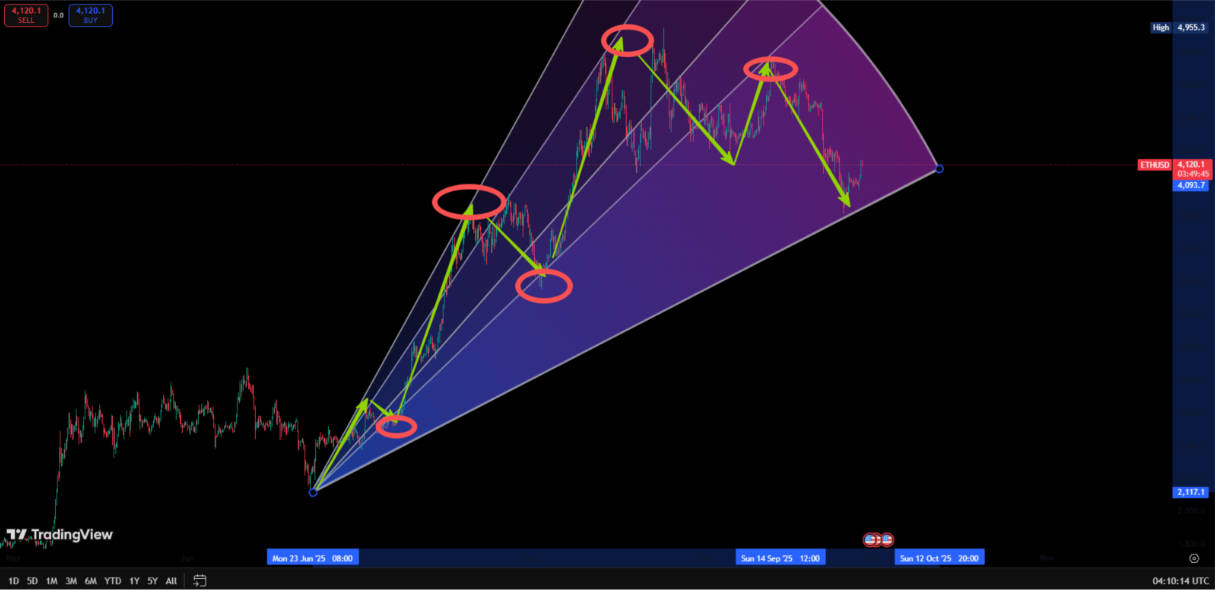
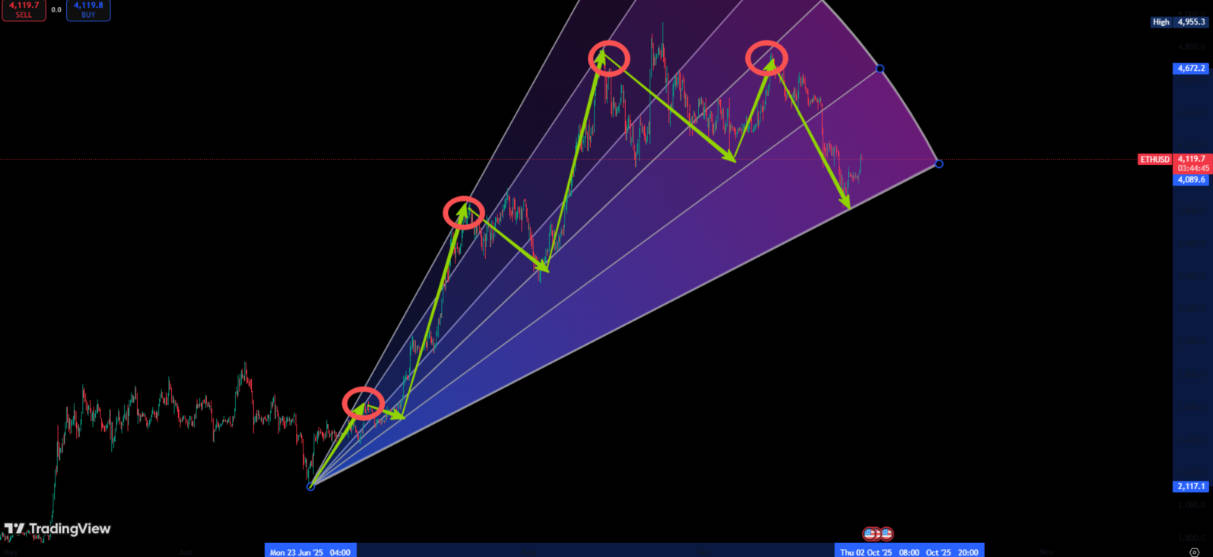
The Projection function is similar to a fan chart.
Identify a swing high and low, then drag to form the fan. The fan structure helps confirm market support and resistance. If price breaks through three consecutive fan trendlines, a trend reversal becomes highly likely.
2. Volume-Based tools
Price and volume alignment is a crucial concept in trading.
Typically, price rising with increasing volume signals strength; price falling with shrinking volume signals weakness. When price and volume diverge, a change of market behaviour is often imminent. Increasingly, indicators incorporate volume to improve their precision.
1) VWAP (Volume-Weighted Average Price)
Compared with simple moving averages, VWAP incorporates volume and weights the average accordingly.
An adjusted VWAP fits price behaviour more closely and makes it easier to spot support and resistance.
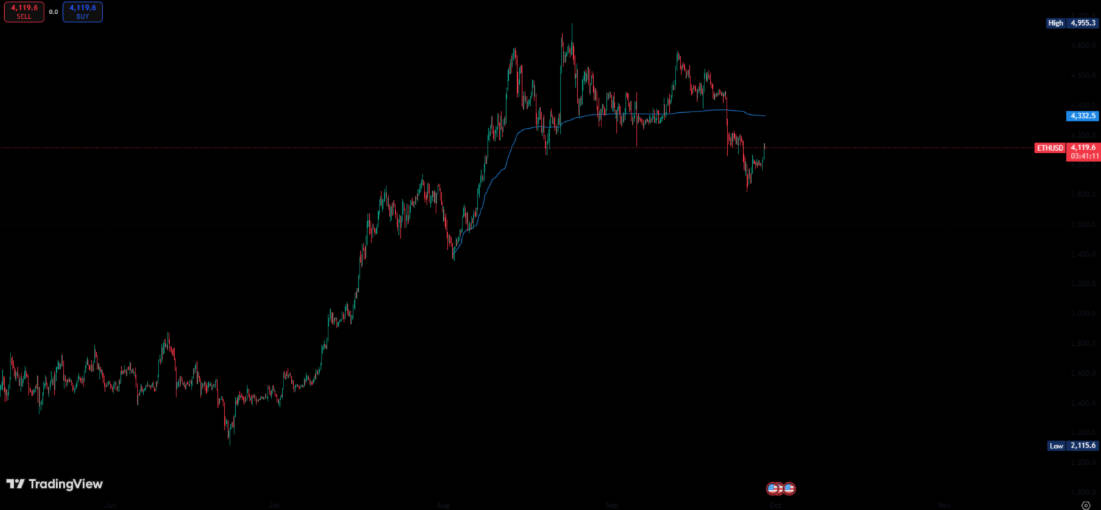
VWAP can also be augmented with standard deviation bands — a structured analogue of Bollinger Bands — which better reveal the degree of price deviation.
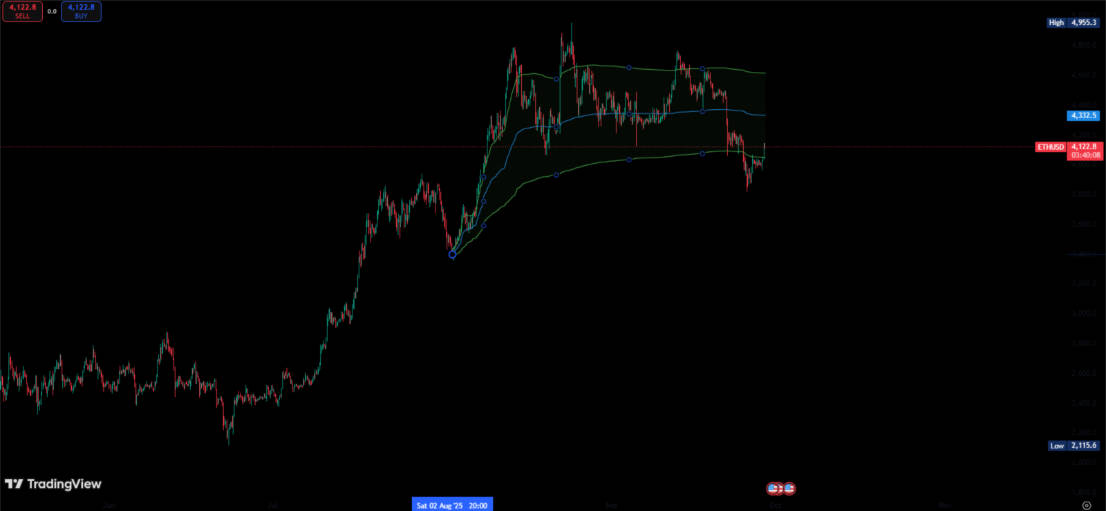
TradingView allows you to add up to three multipliers: right-click the indicator properties and enable multipliers 2# and 3#.
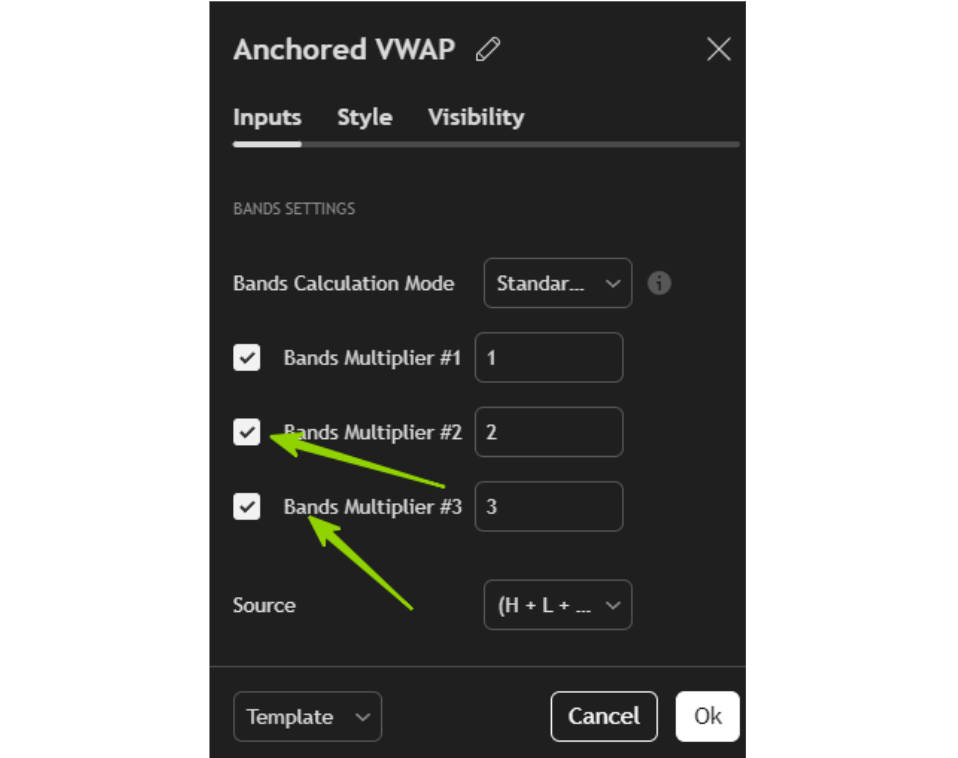
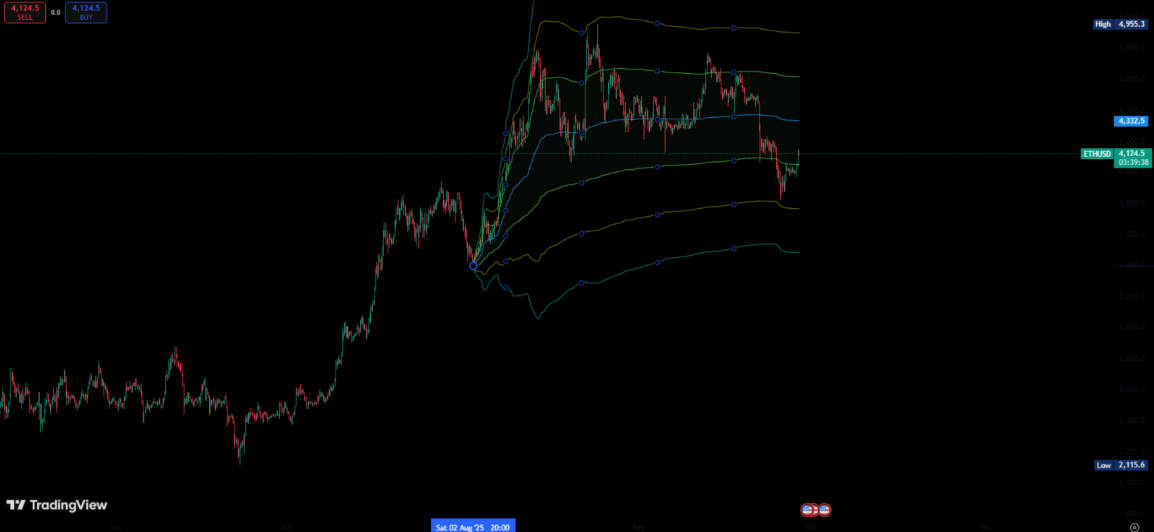
Doing so expands the display to seven deviation lines, which helps identify the scale of deviation more clearly.
2) Range Volume Profile
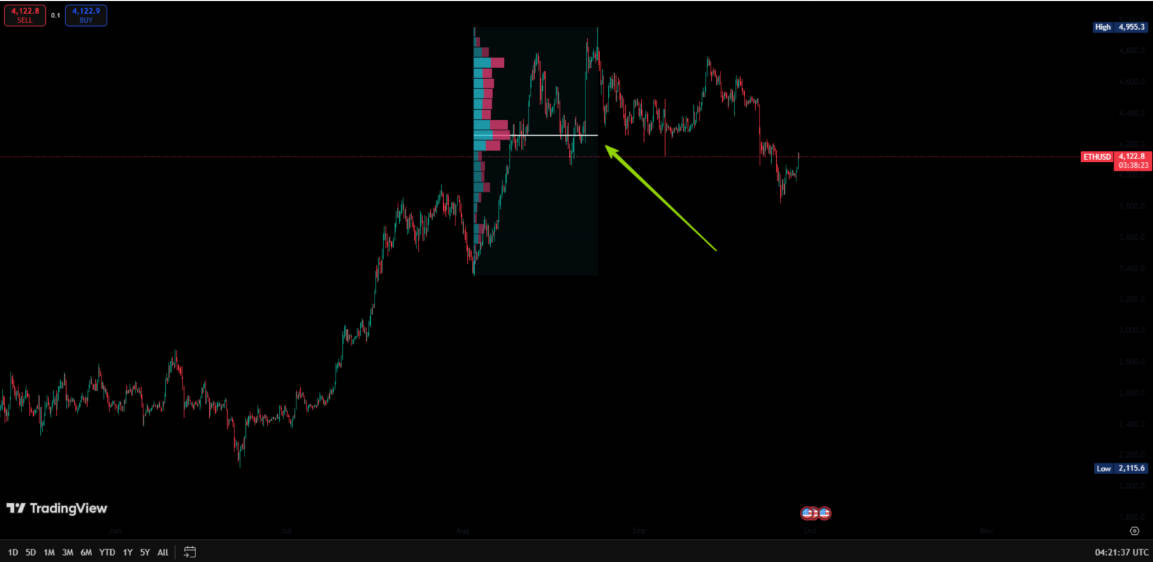
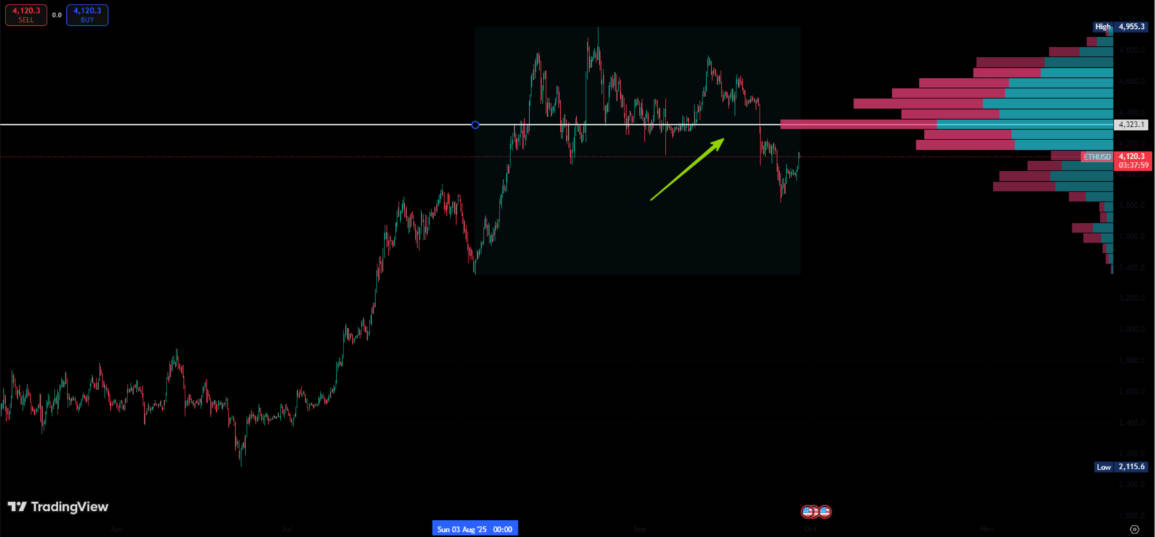
Select a boxed range and the Fixed Range Volume Profile will show the relative buy/sell volume at each price within that selection. The white line indicates the price with the highest traded volume.
In practice, the price with the greatest volume often corresponds to a robust area of support or resistance.
3) Anchored Volume Profile
The Anchored Volume Profile works like the Fixed Range profile, but it is tied to a chosen bar. Click a bar and the profile will display cumulative volume from that bar to the present.
As with the fixed range, the highest-volume price is highlighted with a white line, marking a key support/resistance level.
3. Measurers
In live trading, time and price cycles also guide decision-making.
For example, a short cycle might last 10–15 days. If the market is currently in such a short cycle, once 10–15 bars have formed you should be particularly alert for a possible turning point.
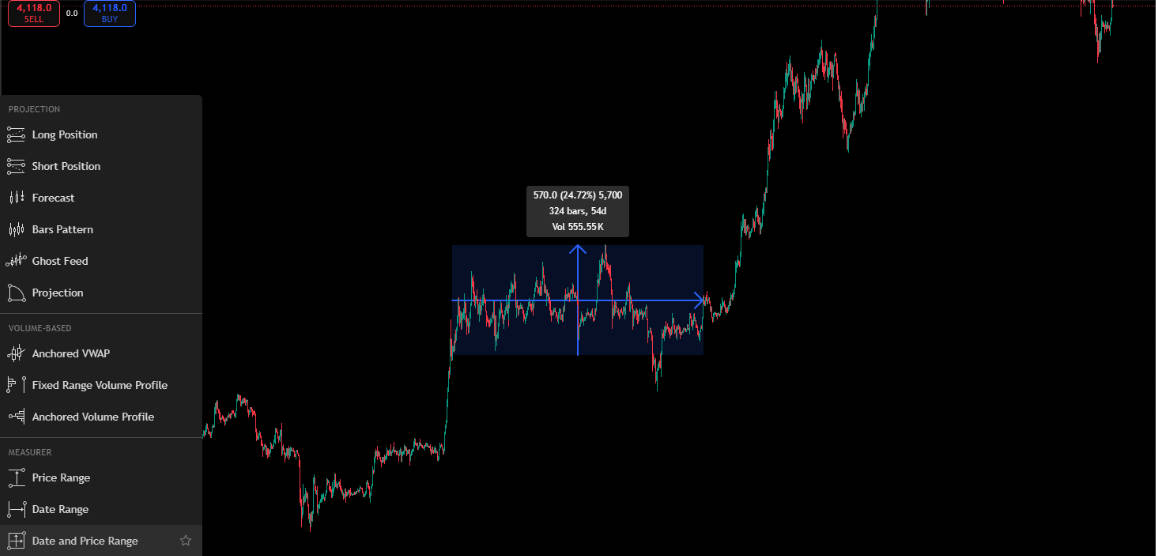
TradingView provides corresponding measurers. By selecting a range of price action you can calculate metrics such as the number of bars, the magnitude of price movement and the traded volume within that frame.
These data are very useful for quantitative analysis.
In short, TradingView's forecasting and measuring tools allow for more precise calculations, offering a clearer understanding of market cycles and timing. They provide substantial support for identifying better entry and exit points.
Disclaimer: This material is for general information purposes only and is not intended as (and should not be considered to be) financial, investment or other advice on which reliance should be placed. No opinion given in the material constitutes a recommendation by EBC or the author that any particular investment, security, transaction or investment strategy is suitable for any specific person.


