Published on: 2025-08-06
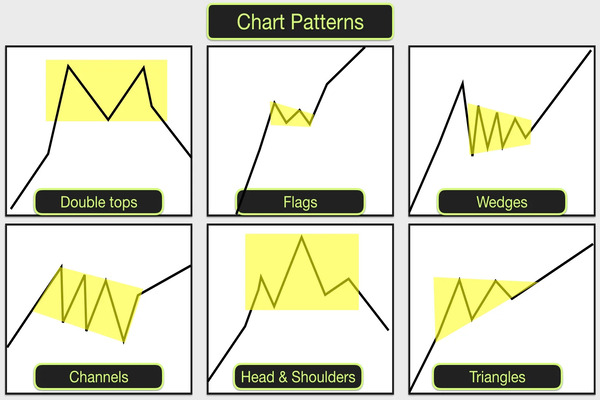
The ascending channel pattern is a chart formation defined by parallel rising trendlines. It signals a steady uptrend and offers clear visual rules for trade entries, targets, and risk management.
Popular across forex, equities, and crypto markets, it helps traders identify logical ranges for support, resistance, and trend continuation.
In this guide, you'll learn how the pattern forms, its strategic nuances, trade entries and exits, and risk-aware tips to deploy it effectively.

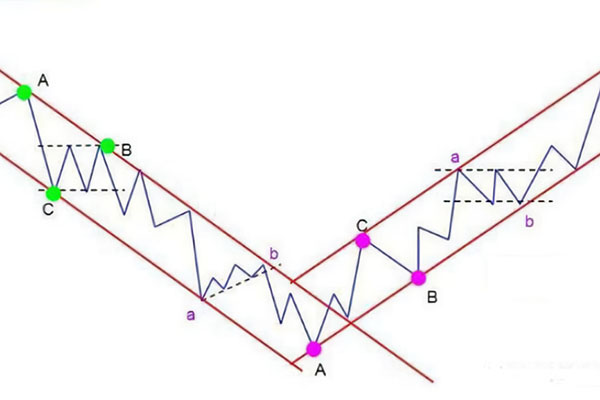
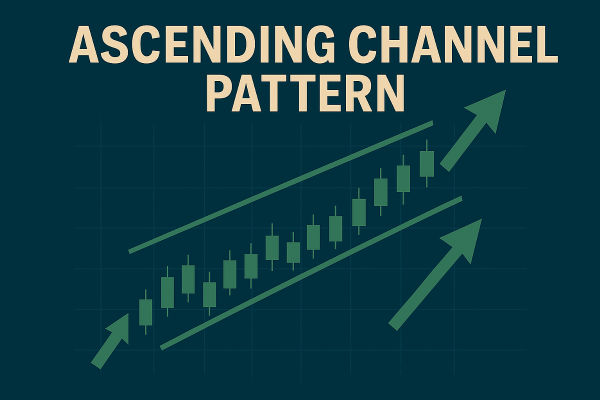
An ascending channel, also known as a rising channel, appears when the price moves upward between two parallel diagonal lines. The lower line connects higher swing lows (support), while the upper line joins higher swing highs (resistance).
The slope indicates bullish momentum: as long as the price stays within the channel, the trend may continue upward.
This pattern works across timeframes:
Daily charts are best suited for swing and position traders.
4H/1H charts are best for intraday trades.
5-minute charts may show minor ascending channels, but trends can break quickly.
Always respect the context: a channel forming in a broader downtrend might fail even on support bounces.

Recognise the Rounding Higher Lows and Higher Highs
Start by confirming a bullish context with a series of higher lows and higher highs. Then draw two trendlines: one across the swing lows, one across swing highs. The lines should be roughly parallel and slope upward.
Check Volume Patterns and Strength Confirmation
Volume often declines within the channel during rallies and pullbacks, then spikes at breakout attempts. Weak volume on breakouts suggests false signals, while accelerating volume confirms structure.
Validate with Multiple Timeframes
A trend confirmed on a higher timeframe (daily) provides context. Switch to lower timeframes (4H or 1H) for precise entries at bounce zones or breakout retests.
Bounces off Support (Ideal Entries)
Buying near the lower trendline after price signals such as hammer bars or bullish engulfing candles offers favourable risk-to-reward setups. Here, stops go just below the swing low.
Breakout Beyond Channel Resistance
When price closes above the upper trendline with volume support, it signals likely trend acceleration. Traders often enter on the breakout or a retest of broken resistance as new support.
Breakdown Below the Channel
A drop or closure beneath the lower trendline indicates a potential weakening or reversal of the trend. Shorting or closing long exposure is viable when followed by confirming the structure.

Step 1: Bounce Entry
Identify the support line that touches the lower channel. Enter when a reversal candle forms near support and volume is low. Place stop-loss slightly below the channel and target near the upper channel resistance or the projected measured move.
Step 2: Breakout Entry
Hold off until the candle finishes above the resistance level. Utilise a limit order at the breakout point or during a retest. The stop is positioned beneath the breakout bar. Aim based on channel height or momentum extension.
Step 3: Trend Reversal Play
If price breaks the lower trendline and fails to retest as support, go short. Confirm with volume surge or price structure change (lower high / lower low). Target measured move is equal to the channel's vertical height.
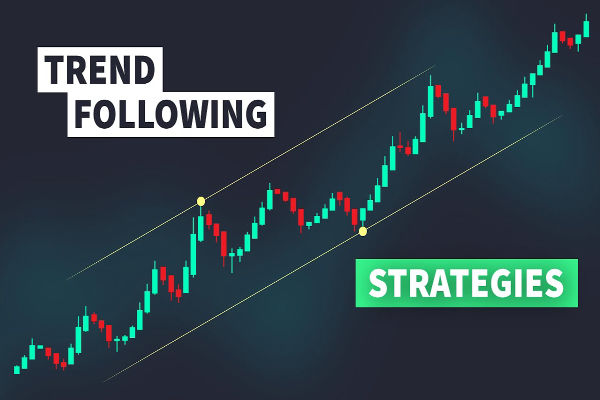
Traders favour ascending channels for several reasons. They provide defined boundaries for entry and exit decisions, allowing precise entries on support bounces or breakout signals above resistance.
Additionally, the pattern's visual clarity helps remove guesswork from trading, and it works across timeframes, making it versatile for swing, intraday, or position traders.
Lastly, it aligns effectively with price-action strategies and integrates smoothly with indicators such as RSI, volume, and moving averages.
Keep position sizes small when trading volatile markets within a channel structure.
Use stop-loss orders just beyond the channel lines to limit damage.
Steer clear of excessive trading in times of consolidation or low volume.
Turn off trades when upcoming major news events may distort channel validity (e.g., rate announcements, GDP releases).
Layer trades: initiate with a partial position on a bounce and increase size as price validates the trend.
Implement trailing stops after the price surpasses the original profit target to secure profits
Use momentum indicators: RSI above 50 or MACD crossing enhances confidence in continuation trades.
Watch for bearish divergence near channel highs to signal impending breakdown.
1. Is the Ascending Channel Pattern Always Bullish?
Yes, the pattern is generally considered bullish, as it reflects rising prices. However, a breakdown below the lower support line can indicate a trend reversal or a bearish shift, so it's vital to watch for changes in momentum.
2. What Indicators Work Well With Ascending Channel Patterns?
Popular indicators that complement ascending channel trading include the Relative Strength Index (RSI) for identifying overbought/oversold conditions, the MACD for confirming momentum, and volume analysis to validate breakouts or reversals.
3. How Do I Know if an Ascending Channel Is About to Break?
Watch for signs like bearish divergence (e.g., price making higher highs while RSI makes lower highs), declining volume on rallies, or a failure to reach the upper channel. A strong bearish candle closing below the support line with volume can confirm a breakdown.
In conclusion, ascending channel patterns offer traders distinct visual signals, organised entry points, and established risk limits, making them suitable for trading in various markets and timeframes.
For beginners building chart-reading skills, mastering the ascending channel is a logical first step toward sound price-action strategies.
Disclaimer: This material is for general information purposes only and is not intended as (and should not be considered to be) financial, investment or other advice on which reliance should be placed. No opinion given in the material constitutes a recommendation by EBC or the author that any particular investment, security, transaction or investment strategy is suitable for any specific person.