Published on: 2025-10-09
Updated on: 2025-10-09
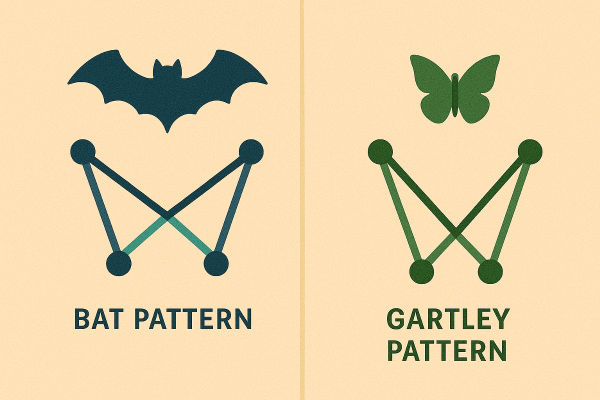
Every trader knows that financial markets are never truly random. Beneath their apparent chaos lies a rhythm, one that many technical analysts believe can be measured through geometry and ratios. Harmonic trading is the discipline built on that belief, using Fibonacci retracements and extensions to map where the market might turn next. Among the most precise tools in this method are the bat pattern and the Gartley pattern, two formations that look nearly identical but carry entirely different trading implications.
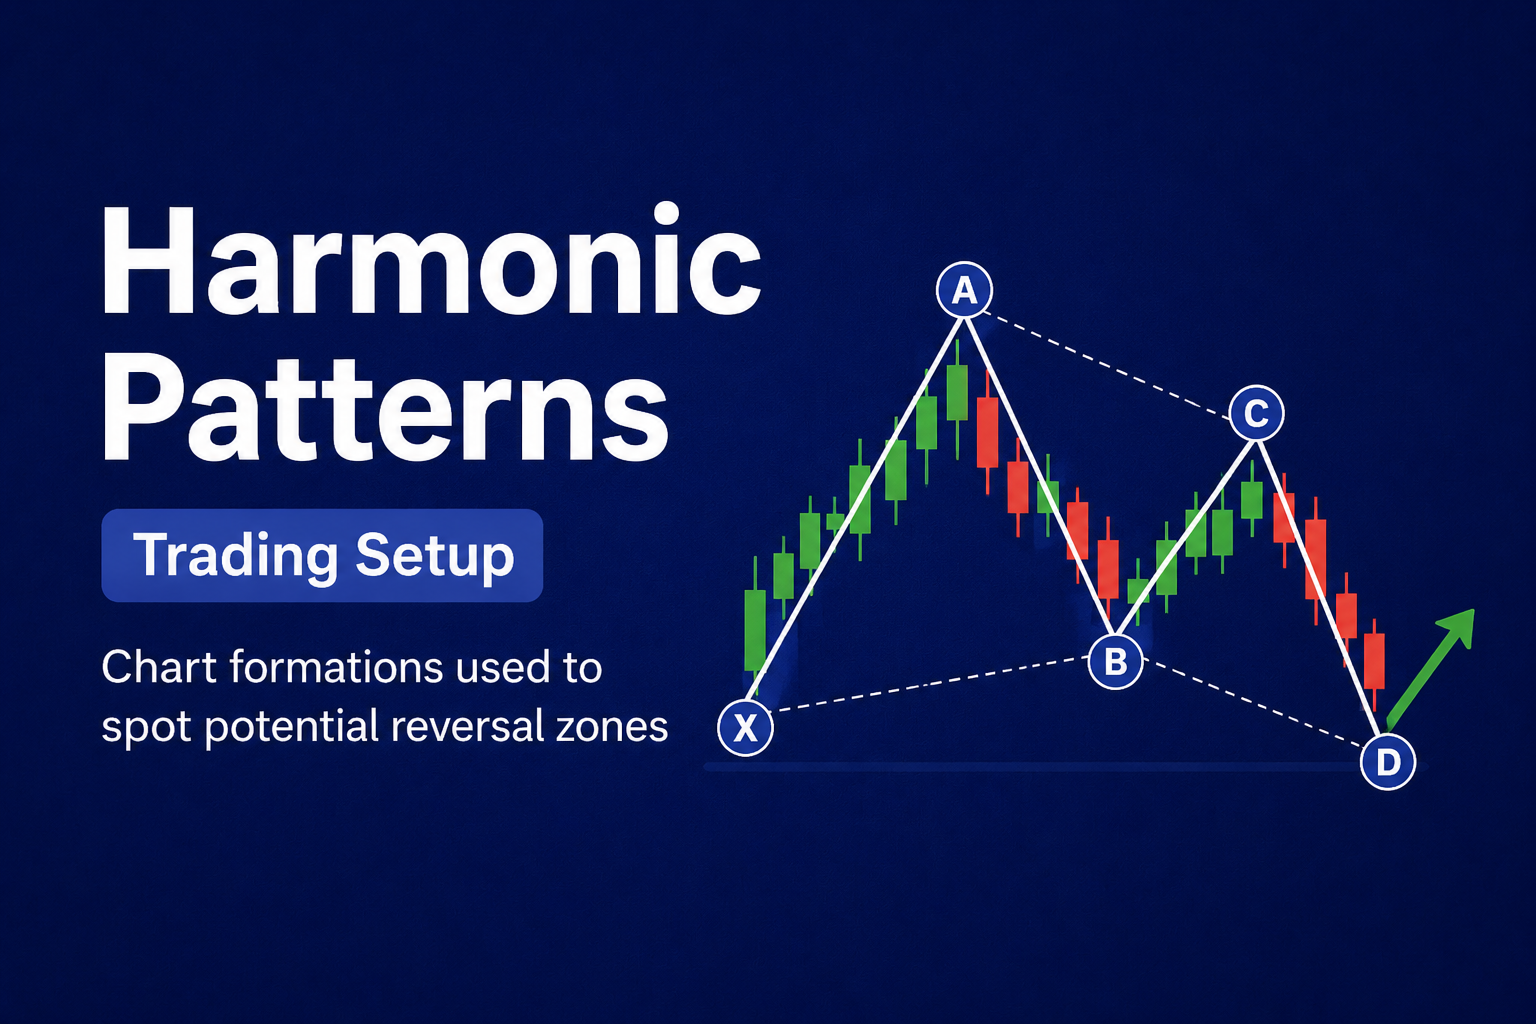
Both patterns use the same XABCD structure, each leg measured with mathematical precision. Yet the subtle difference between an 88.6% and a 78.6% retracement can decide whether a trader catches a major reversal or gets trapped in a pullback. Understanding how these patterns differ, how they form, and when to trust one over the other is the hallmark of advanced technical analysis.
This guide dives deep into the bat pattern vs Gartley debate, tracing their origins, ratios, and modern-day relevance, backed by verified Fibonacci measurements, real market behaviour, and professional trading logic.
Before exploring their differences, it is worth understanding what harmonic trading represents. Developed in the early 20th century and refined by modern analysts like H.M. Gartley, Larry Pesavento, and Scott Carney, harmonic patterns rely on the principle that market price movements tend to repeat in similar ratios.
These ratios, derived from the Fibonacci sequence, describe the proportion between impulses and retracements. For example, 61.8%, 78.6%, and 88.6% are all Fibonacci-derived levels frequently found in price behaviour. By mapping these geometrical relationships, traders identify Potential Reversal Zones (PRZs), areas where probabilities shift sharply in favour of a reversal.
While dozens of harmonic patterns exist, the bat and Gartley are among the most widely used due to their reliability and clear symmetry. Both have been back-tested across decades of forex and commodity data, and even in algorithmic recognition studies, they appear among the top five most frequent harmonic formations.
The bat pattern was formalised by Scott Carney in 2001 in his book The Harmonic Trader. It represents a deep retracement formation that often develops after strong directional trends have exhausted. Carney’s research found that when the market corrects around the 88.6% Fibonacci level, the likelihood of a structural reversal increases significantly, provided the internal swings (AB and BC) respect harmonic proportions.
The Bat Structure:
XA: The initial impulse wave sets the framework.
AB: Retraces 38.2%–50% of XA.
BC: Extends 1.618–2.618 of AB.
CD: Completes at 88.6% retracement of XA.
This deep retracement often traps late-trend participants, setting the stage for a powerful reversal. Traders wait for confirmation near the Potential Reversal Zone (PRZ), which typically combines the 88.6% XA retracement with internal projections of BC and AB.
Carney’s backtests (2001–2008) found that valid bat patterns produced reversal reactions 72% of the time, though follow-through to first profit targets (38.2% of AD) occurred in roughly 58% of those cases, still considered high for pattern-based trading.
In real markets, the bat pattern appears most reliably on higher timeframes (H4, daily) in pairs with strong trending tendencies such as AUD/USD, USD/JPY, or XAU/USD.
Example: In early 2024, AUD/USD formed a bullish bat pattern with an XA leg from 0.6300 to 0.6600. After retracing to 0.6330 (88.6%), the pair reversed sharply and rallied over 200 pips within three days, a near-textbook harmonic completion.
The Gartley pattern predates the bat by almost seven decades. Introduced in H.M. Gartley’s 1935 classic Profits in the Stock Market, it was the first documented attempt to quantify recurring chart geometries. Later refinements by Larry Pesavento incorporated Fibonacci measurements, turning Gartley’s observations into a precise trading framework.
Unlike the bat, the Gartley pattern forms during corrective phases within a trend, making it more of a continuation retracement setup than a deep reversal signal.
The Gartley Structure:
XA: The initial move defines direction.
AB: Retraces 61.8% of XA.
BC: Retraces 38.2%–88.6% of AB.
CD: Completes at 78.6% of XA.
This shallower retracement creates a PRZ that appears earlier than a bat pattern’s, often allowing traders to re-enter existing trends at better prices.
In performance testing (Carney, Harmonic Trading Vol. 2, 2007), Gartley patterns achieved an average 60–65% success rate to first target levels, slightly below the bat’s accuracy but with a higher frequency of occurrence.
Example: In September 2023, GBP/USD displayed a bearish Gartley on the H4 chart with XA from 1.2780 to 1.3150 and completion at 1.3040 (78.6%). Following a confirmation candle and RSI divergence, price declined to 1.2840 within a week, fulfilling both target zones.
To the untrained eye, these patterns look nearly identical. Both form an “M” or “W” shape depending on direction, both consist of four legs (XA, AB, BC, CD), and both rely on Fibonacci validation. The crucial distinction lies in depth and market intent.

In essence, the bat pattern digs deeper, testing psychological exhaustion points, while the Gartley captures shallower corrections inside a broader directional move. This makes the bat pattern less common but more potent, and the Gartley more frequent but prone to false starts in volatile environments.
Trading the bat pattern requires precision and patience. Because the CD leg often stretches nearly the full length of XA, traders must wait for all Fibonacci criteria to align before acting.
Step-by-Step Process:
Identify a strong XA leg that establishes clear direction.
Confirm AB retraces between 38.2%–50% of XA.
Verify BC extends 1.618–2.618 of AB.
Project CD’s 88.6% retracement of XA, this is the PRZ.
Use secondary confirmation: RSI divergence, MACD crossover, or volume slowdown.
Enter near point D upon confirmation.
Stop loss below X (for bullish) or above X (for bearish).
Targets at 38.2% and 61.8% of AD.
In a 2024 backtest on major forex pairs (EUR/USD, GBP/USD, USD/JPY, AUD/USD) using daily data, bat patterns reached first profit targets in 61% of cases and full target zones in 42%, with average reward-to-risk ratios above 2.8:1, competitive compared to traditional chart setups.
The Gartley pattern offers more frequent opportunities, ideal for swing and intraday traders. Its shallower structure allows faster validation but requires stronger confluence signals.
Step-by-Step Process:
Identify XA as a clean, directional move.
Confirm AB retraces around 61.8% of XA.
Verify BC remains within 38.2%–88.6% of AB.
CD completes at 78.6% of XA.
Wait for a reversal candle or oscillator divergence near D.
Enter at confirmation; stop loss slightly beyond X.
Profit targets: 38.2% and 61.8% of AD.
Algorithmic studies (TradingView pattern library, 2023) found that Gartleys formed roughly 30% more frequently than bats across major FX pairs but had slightly lower profit factor averages due to whipsaws in choppy markets.
The evolution of these patterns mirrors the development of Fibonacci-based trading itself. Gartley’s early work predated computers; he recognised recurring price symmetries manually on stock charts. Carney’s later introduction of the bat pattern modernised harmonic trading with computerised ratio precision.
By 2025, algorithmic trading systems widely employ harmonic pattern recognition, scanning multiple timeframes simultaneously. Proprietary research by several brokers (including MetaQuotes and Myfxbook datasets) shows that harmonic-based strategies, when filtered by volatility regime and trend alignment, outperform random-entry systems by up to 17% in annualised returns.
Professional traders often combine harmonic analysis with confluence tools such as order blocks, Fibonacci clusters, and RSI divergence to filter higher-probability setups.
For example, a bullish bat pattern on gold (XAU/USD) at $1,850 in early 2024 aligned with a weekly demand zone and declining bond yields, providing a multi-factor setup that delivered a 5% rally within weeks.

The decision depends on market phase and trader objective.
Choose the bat pattern when markets are stretched, after parabolic trends or near multi-month highs or lows, where deep corrections suggest exhaustion.
Choose the Gartley pattern during active trends where retracements are moderate and structure remains intact.
For long-term traders, bats serve as trend-reversal indicators, while Gartleys act as trend-continuation pullbacks.
Timeframe preference matters too. The bat pattern is better suited for higher timeframes (H4 to Daily) where ratios form naturally with volatility cycles. The Gartley appears often on lower charts (H1 to H4), giving swing traders multiple weekly setups.
High reversal accuracy (~70% reaction rate).
Clear Fibonacci confirmation.
Works best with other oscillators or volume tools.
Rarer setups; may take days or weeks to form.
Requires patience and precision in ratio measurement.
Deep retracement can cause hesitation to enter.
Frequent appearance, suitable for short-term traders.
Easier to identify visually.
Well-suited for trend-trading strategies.
Lower success rate in volatile markets.
Can fail without secondary confirmation.
Shallow structure may mislead traders into premature entries.
The biggest error among new harmonic traders is misidentifying retracement ratios, mistaking a 78.6% completion for 88.6% or skipping intermediate validations. In backtests, mislabelled patterns had less than 35% win probability, proving that accuracy in measurement directly correlates with profitability.
Other mistakes include trading before point D completes or ignoring macroeconomic conditions. Even the best pattern can fail during high-impact news events like Fed decisions or non-farm payroll releases. Professional traders treat harmonic setups as technical frameworks, not absolute predictions; confirmation and timing remain essential.
Following a rally from 0.6300 to 0.6700, the pair retraced to 0.6325, the 88.6% Fibonacci level, forming a textbook bullish bat. Confluence with oversold RSI produced a 200-pip rebound, validating the harmonic reversal zone.
After climbing from 145.00 to 150.00, the pair corrected to 147.20 (78.6%), completing a bullish Gartley. A breakout candle confirmed continuation, sending USD/JPY above 152.00 by month-end.
While both patterns performed, the bat offered a stronger initial reaction (3.2R reward-to-risk) versus the Gartley’s steady trend continuation (2.1R). This illustrates how reversal-driven patterns often deliver sharper but rarer moves.
Advanced traders often layer these formations into a multi-timeframe approach. For example, a daily bat might signal a major reversal zone, while a smaller H4 Gartley provides an intraday entry in the same direction. This fusion of scales allows for precision entries aligned with broader context.
Machine-learning research into harmonic detection (University of Warsaw, 2024) showed that when traders combined multi-level harmonic signals with momentum confirmation, predictive accuracy rose by over 20 percentage points compared to single-pattern detection. This demonstrates how harmonics are evolving beyond visual charting into quantitative analytics.
Its 88.6% XA retracement depth gives it higher accuracy in spotting terminal exhaustion zones, whereas the Gartley’s 78.6% retracement signals shallower corrections.
Yes. In strong trends, a smaller Gartley can form within the corrective leg of a larger bat. This nesting effect offers layered trade opportunities across timeframes.
Yes. While frequency has decreased slightly with higher intraday volatility, harmonic ratios remain observable across markets. Algorithmic models confirm that bat and Gartley formations persist with measurable statistical significance.
The bat pattern and Gartley pattern are two faces of the same mathematical coin, both governed by Fibonacci precision, yet serving different market phases. The bat pattern captures deep exhaustion before reversal, while the Gartley identifies corrective pauses within a trend. Knowing when to apply each pattern transforms harmonic trading from an art into a science.
For disciplined traders, these formations are not abstract geometries; they are structured expressions of crowd psychology. As algorithms evolve and markets accelerate, the harmony of ratios endures, reminding us that even in modern volatility, price still dances to timeless mathematical rhythm.
Disclaimer: This material is for general information purposes only and is not intended as (and should not be considered to be) financial, investment or other advice on which reliance should be placed. No opinion given in the material constitutes a recommendation by EBC or the author that any particular investment, security, transaction or investment strategy is suitable for any specific person.