Published on: 2025-06-16
Updated on: 2025-06-16
The Gartley pattern is a well-known chart formation in technical analysis, valued for its ability to signal potential reversals with high precision. First introduced in the 1930s, it has since evolved into a cornerstone of harmonic trading, combining geometric symmetry with Fibonacci ratios. For traders seeking structured, rule-based setups, the Gartley offers a visually recognisable and mathematically grounded way to anticipate price movements—especially within corrective phases of larger trends.
The Gartley pattern was first introduced by H.M. Gartley in his 1935 book Profits in the stock market. In that work, he presented a chart pattern that resembled the modern version of what we now call the "Gartley 222".
The name "222" refers to the page number where the pattern first appeared in Gartley's book. Although the original version did not rely on Fibonacci retracements, later refinements—particularly those introduced by Scott Carney, a key figure in harmonic trading—integrated Fibonacci ratios to create the more precise version used today.
This harmonic pattern attempts to capture natural market movements, highlighting areas where price is likely to reverse due to the interplay between buyers and sellers, often in reaction to previous trends or corrections.

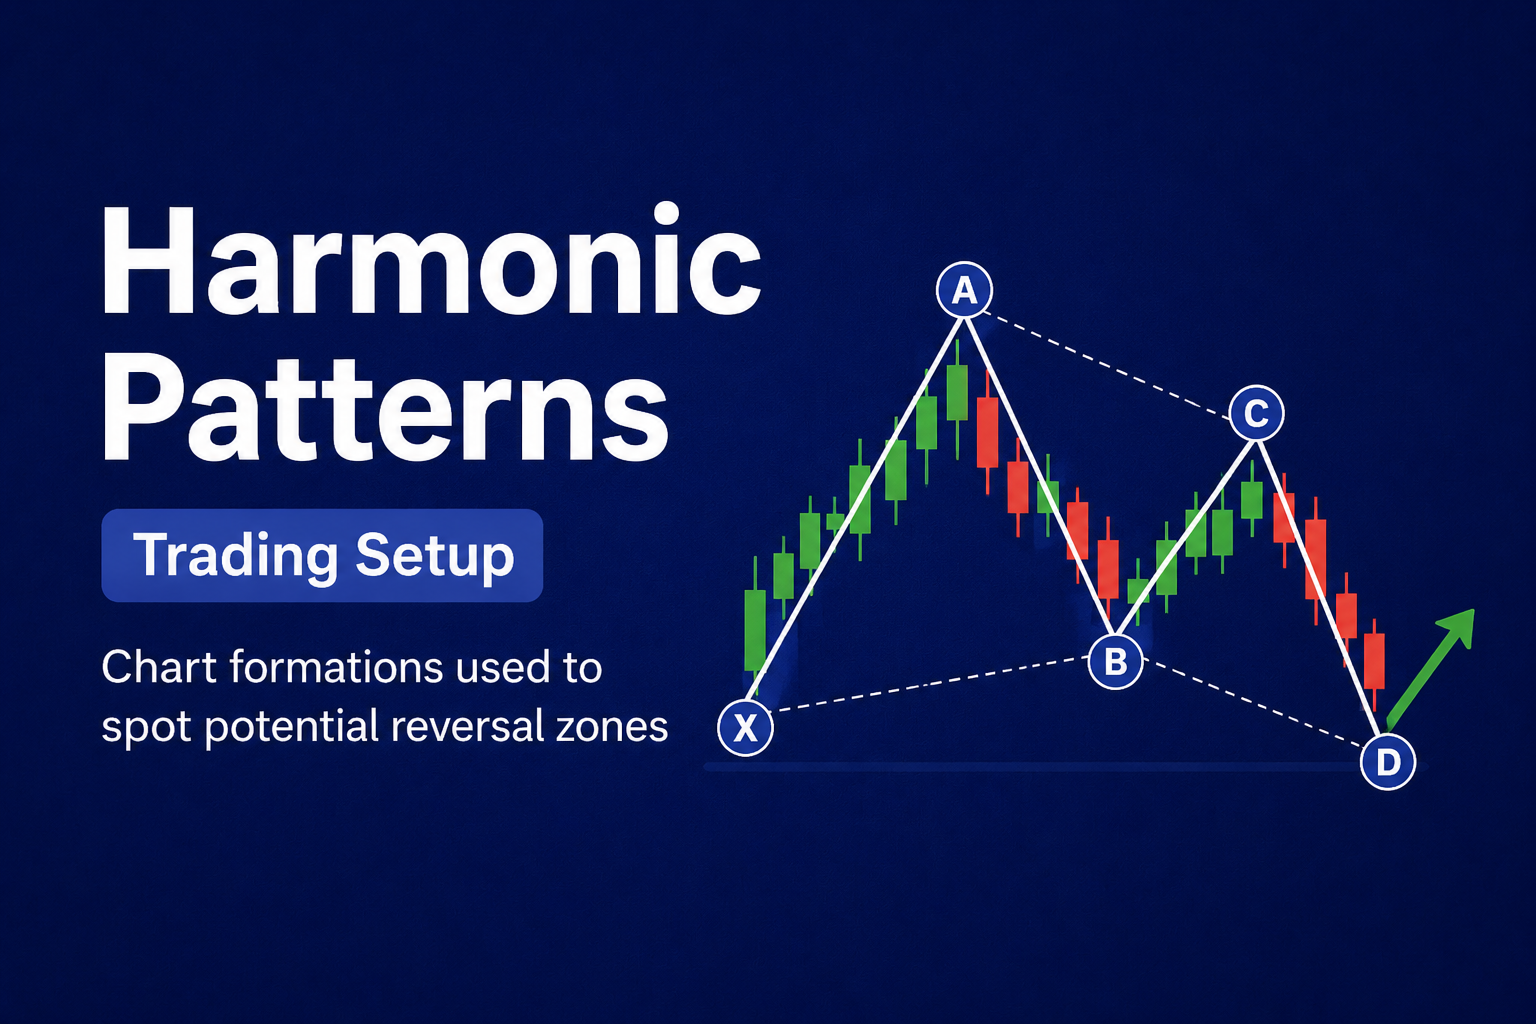
The Gartley pattern is defined by five points labelled X, A, B, C, and D, which form a specific structure. It's neither purely a retracement nor a reversal pattern; rather, it's a combination of both. The pattern essentially reflects a corrective structure within a larger trend.
Here's a breakdown of each leg:
XA – The initial price move, either bullish or bearish.
AB – A retracement of the XA move, typically retracing 61.8% of XA.
BC – A move in the opposite direction of AB, retracing 38.2% to 88.6% of AB.
CD – The final leg, ideally ending near a 78.6% retracement of XA, completing the pattern at point D.
Once point D is formed, the expectation is that the price will reverse, offering a potential trade entry. Importantly, D is not a breakout point, but rather a reversal zone where price is anticipated to pivot.
The precision of these legs is crucial. Deviations from the required Fibonacci levels may invalidate the pattern or lower its probability of success.
 The Gartley pattern is Fibonacci-dependent, meaning that without proper alignment of retracement and extension levels, the pattern isn't considered valid. The most important ratios are as follows:
AB retraces 61.8% of XA
BC retraces 38.2% to 88.6% of AB
CD is an extension of BC, usually reaching 127.2% or 161.8%
AD completes at a 78.6% retracement of XA
These ratios are not arbitrary—they're based on natural proportions found in mathematics, nature, and, evidently, financial markets. They help traders quantify price structure rather than relying on subjective pattern recognition.
One of the key aspects of the Gartley pattern is the Potential Reversal Zone (PRZ). This is the area where point D completes and multiple Fibonacci levels cluster together, increasing the likelihood of a reversal. The tighter the confluence, the stronger the signal.

The Gartley pattern appears in two forms depending on market direction:
Bullish Gartley – Resembles a distorted "W" shape. It begins with a down move (XA), followed by a minor up move (AB), a pullback (BC), and a final dip (CD) into the PRZ. A reversal to the upside is expected at D.
Bearish Gartley – Forms a modified "M" shape. It starts with an up move (XA), then a retracement (AB), a minor rally (BC), and a final rise (CD) into the PRZ. The pattern anticipates a downward reversal from D.
In both cases, the key is the symmetry and proportion of the legs. Traders often use pattern recognition software or manual drawing tools to identify potential Gartleys on different timeframes.
The pattern can appear in various asset classes—stocks, forex, commodities, and cryptocurrencies—though it tends to be more reliable on higher timeframes such as the 4-hour or daily charts.
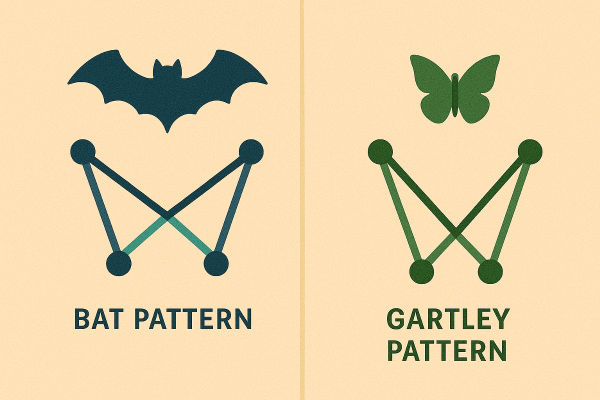
The Gartley pattern is often compared with similar harmonic structures, such as the Butterfly, Bat, and Crab patterns. While all these patterns use Fibonacci ratios and share similar geometry, they differ mainly in the length of the CD leg and where point D completes relative to the initial XA move.
Here's how the Gartley stands apart:
Gartley vs Butterfly – In the Butterfly pattern, point D extends beyond point X, whereas in the Gartley, D remains within the XA leg.
Gartley vs Bat – The Bat pattern uses a deeper retracement for AB (typically 50%) and a more shallow CD leg.
Gartley vs Crab – The Crab features an extreme extension of the CD leg, often reaching 161.8% of XA, making it more volatile but potentially more rewarding.
In summary, the Gartley pattern is less aggressive than the Butterfly or Crab patterns. It offers a more conservative setup, especially suitable for traders who prefer structure-based trading without the high-risk extensions seen in other harmonic patterns.
The Gartley '222' pattern remains one of the most powerful tools in harmonic trading. It blends historical chart theory with Fibonacci precision, providing a clear framework for anticipating market reversals. Although it requires accuracy and patience to execute correctly, the pattern offers high-probability trading opportunities when applied with discipline.
Whether you're new to harmonic patterns or looking to refine your chart analysis, mastering the Gartley can enhance your ability to navigate complex market structures with confidence.
Disclaimer: This material is for general information purposes only and is not intended as (and should not be considered to be) financial, investment or other advice on which reliance should be placed. No opinion given in the material constitutes a recommendation by EBC or the author that any particular investment, security, transaction or investment strategy is suitable for any specific person.