Understanding the Butterfly Pattern Structure

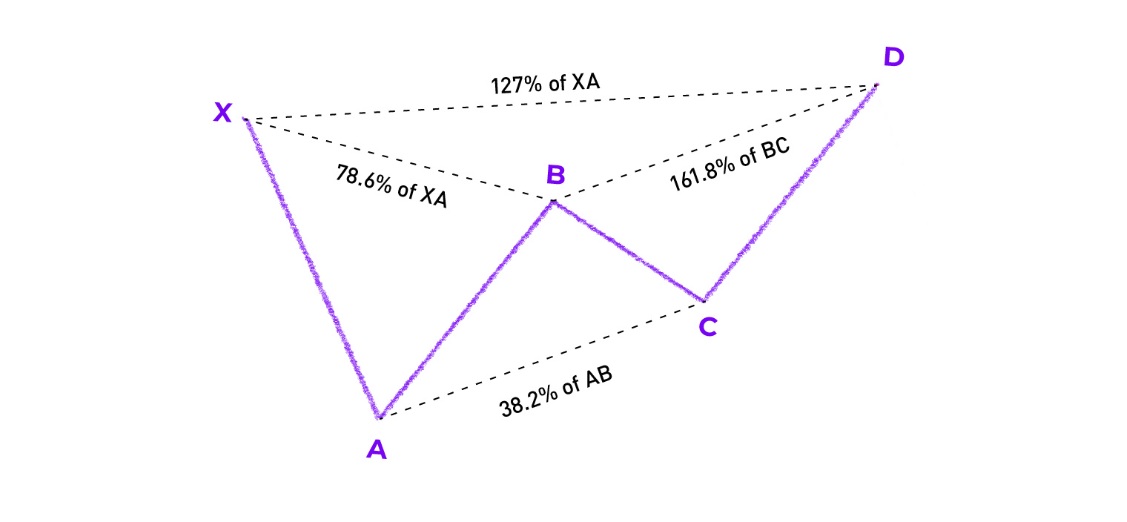
The Butterfly pattern is one of the most recognisable formations within harmonic trading. First identified by Bryce Gilmore and later refined by Scott Carney, this geometric configuration uses Fibonacci ratios to highlight potential reversal zones. Shaped like a butterfly with symmetrical wings, it is a five-point pattern labelled X-A-B-C-D, consisting of four connected price swings.
What makes the Butterfly distinctive is that it often appears at the end of extended trends, signalling a potential reversal with a high degree of accuracy when validated by Fibonacci proportions. Traders prize the pattern because it provides a structured framework for identifying precise entry, stop-loss, and profit-taking levels, rather than relying solely on subjective chart analysis.
Fibonacci Ratio Rules (XA, AB, BC, CD)
The Butterfly pattern is defined by strict Fibonacci measurements that distinguish it from other harmonic patterns, such as the Gartley or Bat:
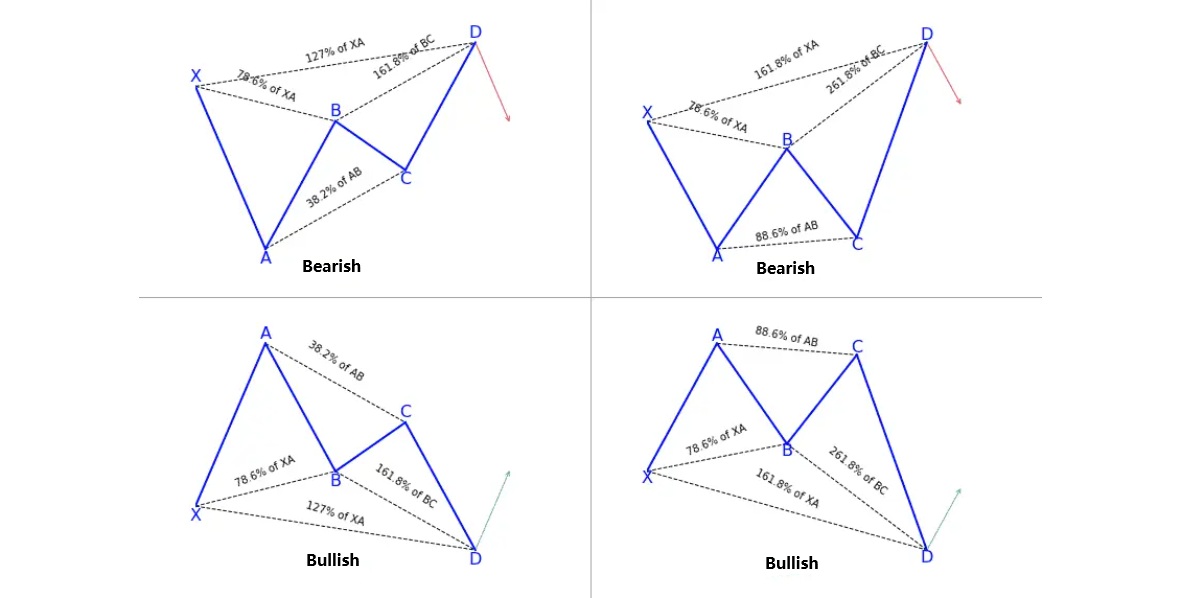
AB retracement: should be close to 78.6% of the XA leg.
BC retracement: typically ranges from 38.2% to 88.6% of the AB leg.
CD extension: the defining leg of the Butterfly, extending to 127%–161.8% of XA or 161.8%–261.8% of BC.
The point D is the most important aspect of the formation, often referred to as the Potential Reversal Zone (PRZ). It is here that the confluence of Fibonacci extensions and retracements creates a strong probability for price to change direction.
By adhering to these numerical relationships, traders avoid misidentifying random swings as valid Butterflies. Unlike looser chart patterns, the Butterfly's rigidity is what gives it predictive power.
Identifying Valid Butterfly Patterns

Spotting a Butterfly pattern in real-time can be challenging because it requires precision and patience. The following steps are commonly used:
Mapping the XA leg – identify the initial impulse move.
Verifying AB retracement – ensure the pullback sits near 78.6% of XA.
Checking BC leg – look for a retracement within the Fibonacci zone of AB.
Measuring CD extension – confirm that CD stretches into the PRZ (127%–161.8% of XA).
Traders often rely on charting platforms like TradingView or MetaTrader equipped with Fibonacci tools. Some also employ ZigZag indicators to help mark swing points more clearly.
While Butterflies do not appear frequently, they are valued precisely because of their rarity and reliability. Rushing into loosely defined structures dilutes the strategy, so traders must remain disciplined in waiting for valid confirmations.
Trade Entry Signals and Confirmation
Once a Butterfly pattern is complete and the price reaches the PRZ at point D, traders prepare to enter in the opposite direction of the preceding CD leg. However, instead of blindly placing trades, seasoned practitioners seek confirmation signals such as:
Candlestick reversal patterns – e.g., pin bars, engulfing candles.
Divergence on oscillators – RSI or MACD showing weakening momentum.
Volume spikes – suggesting exhaustion of the prevailing trend.
For example, in a bullish Butterfly, traders anticipate price rising after reaching the PRZ. In a bearish Butterfly, the expectation is for price to fall. Entries are usually executed as soon as the reversal is confirmed, either through market orders or pending limit orders placed slightly within the PRZ.
Stop Loss and Risk Management in Butterfly Pattern Trading

The Butterfly pattern is attractive because it naturally defines risk. Stop losses are generally positioned just beyond point D, as a break significantly past the PRZ invalidates the setup.
Position sizing is equally critical. As with all harmonic strategies, the win rate is not guaranteed, but when correct, the risk-to-reward ratio is often highly favourable (commonly 1:2 or greater).
Setting Profit Targets and Exits
Profit targets in Butterfly trading are derived from Fibonacci retracements of the CD leg and key structural levels:
First target: the 38.2% retracement of CD – often used to secure partial profits.
Second target: the 61.8% retracement of CD – a popular level for scaling out.
Extended targets: structural points such as C or A, depending on risk appetite.
Traders can also adopt trailing stop methods, locking in gains as the price moves in their favour. This not only safeguards profits but also allows positions to capture larger moves when reversals evolve into full trend shifts.
Conclusion
The Butterfly pattern is one of the most precise harmonic structures, offering traders a disciplined framework for identifying potential market reversals. By adhering to Fibonacci ratio rules, confirming entry signals, and applying sound risk management, traders can transform this elegant pattern into a highly effective trading strategy.
Although spotting valid Butterflies requires patience, their rarity is what makes them valuable. When correctly identified and executed, the Butterfly pattern provides not only clear entry and exit points but also the psychological advantage of trading with structured rules rather than guesswork.
For those seeking to elevate their technical analysis beyond conventional support and resistance, the Butterfly remains a timeless and powerful tool in the harmonic trader's toolkit.
Frequently Asked Questions (FAQ)
Q1. What is the Butterfly Pattern in trading?
The Butterfly is a harmonic chart pattern based on Fibonacci ratios. It forms with four legs (X-A, A-B, B-C, C-D) and helps traders identify potential market reversals at point D, also called the Potential Reversal Zone (PRZ).
Q2. How accurate is the Butterfly Pattern?
The Butterfly can be highly reliable if correctly identified, as it uses strict Fibonacci measurements. However, like all strategies, it is not foolproof. Accuracy improves when combined with confirmation signals such as candlestick patterns or momentum indicators.
Q3. What markets are best suited for Butterfly Pattern Trading?
The Butterfly pattern is versatile and can be applied in forex, stocks, commodities, and crypto markets. It works best in liquid markets where price movements respect technical levels and Fibonacci retracements.
Disclaimer: This material is for general information purposes only and is not intended as (and should not be considered to be) financial, investment or other advice on which reliance should be placed. No opinion given in the material constitutes a recommendation by EBC or the author that any particular investment, security, transaction or investment strategy is suitable for any specific person.


