Published on: 2025-04-17
Updated on: 2025-10-27
Understanding market risk and volatility is essential for any investor aiming to make sound financial decisions. Among the most important tools in risk analysis is standard deviation (SD), a statistical measure that quantifies how much investment returns vary from their average.
By translating price movement into measurable volatility, standard deviation gives traders a clear, data-driven picture of an asset’s risk profile. It helps distinguish between stable investments and those prone to large, unpredictable swings.

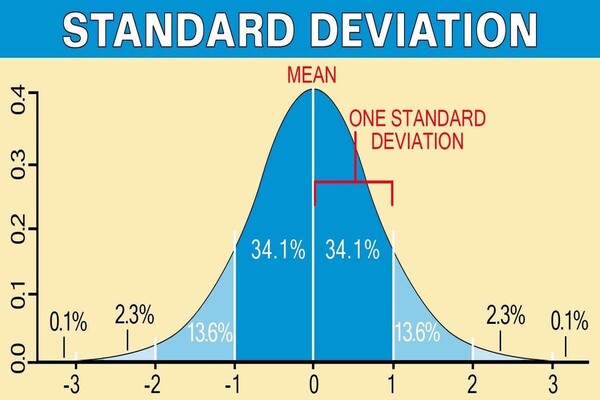
Standard deviation measures how much prices or returns differ from their mean (average) value over time. In financial terms, it quantifies volatility, the degree of fluctuation in an asset’s price or return.
A high standard deviation signals greater variability, meaning large price swings and higher potential risk. Conversely, a low standard deviation indicates that returns are clustered closely around the average, reflecting relative stability and predictability.
For example, a stock with a 20% SD is far more volatile than one with a 5% SD. That volatility may represent opportunity for traders seeking momentum, but also higher risk for long-term investors seeking steady growth.
High SD - Large price swings and higher risk.
Low SD - More stable returns and predictable performance.
In essence, standard deviation quantifies the consistency or inconsistency of returns, allowing investors to assess how much deviation they might expect from average performance.
Formula:
 Where:
xix_ixi = individual data point (price or return)
μ\muμ = mean of the data set
NNN = number of data points
This transforms a series of historical returns into a single number that expresses variability and risk.
Traders and portfolio managers rely on standard deviation not just as a statistical concept, but as a real-time decision tool for risk control and timing.
Many professionals size their trades based on volatility. For instance, if a stock’s daily SD is 2%, a trader might set a stop-loss at two standard deviations below the entry price, about a 4% move to avoid being shaken out by normal market noise.
The same logic helps determine position size: higher SD means smaller position, keeping total portfolio risk balanced.

Sudden spikes in SD often precede major reversals or heightened volatility. For example, during early 2025, Bitcoin’s SD surged from 45% to over 70% as speculative activity intensified, an early signal that price corrections were imminent.
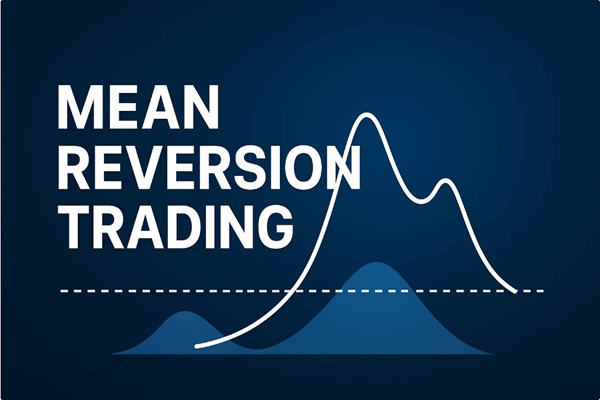
Similarly, when SD compresses to unusually low levels, it may indicate a calm before the storm, prompting traders to prepare for breakout opportunities.
Institutional investors also use SD to screen ETFs. An S&P 500 ETF with a 10% SD might be a core holding, while a small-cap growth ETF at 22% SD fits only for higher-risk satellite positions.
Understanding volatility at the fund level helps maintain diversification discipline and keeps overall portfolio swings within acceptable bounds.
Investors in trading world use Standard Deviation to:
Compare risk across assets: Stock A with SD of 12% is riskier than Stock B at 6%.
Assess portfolio volatility: SD helps estimate expected swings in total portfolio value.
Identify unusual market behavior: Sharp rises in SD may signal market stress or speculative bubbles.
Support investment decisions: Risk-tolerant investors may favor higher SD assets for potential larger returns, while conservative investors prioritize stability.
As of October 2025, the S&P 500’s trailing 12-month volatility is around 15%, while the Nasdaq 100 shows an SD near 20%, reflecting the tech sector’s higher sensitivity to market cycles.
Gold and other commodities average around 10–12%, offering moderate volatility and diversification value.
Diversification reduces overall portfolio risk by combining assets with varying correlations. Standard deviation helps quantify the effect.
Positive Correlation: Assets move together - high combined SD.
Negative Correlation: Assets move inversely - combined SD decreases.
Example:
Stock A (volatile, SD 12%)
Bond B (stable, SD 4%)
Combined in a 60/40 allocation - overall SD drops to 8–9%, depending on correlation.
Diversification smooths returns and lowers portfolio risk without sacrificing expected returns, forming the basis of modern portfolio theory (MPT).
Standard deviation levels differ sharply across asset classes, reflecting each market’s unique risk and volatility profile. The table below outlines 2025 estimates, helping investors gauge how various assets contribute to overall portfolio stability or fluctuation.
| Asset Class | 2025 SD Estimate | Notes |
|---|---|---|
| Large-cap US Stocks | 12–15% | Highly liquid, moderate risk |
| Mid/Small-cap Stocks | 18–25% | Higher volatility, potential for higher returns |
| Bonds | 3–6% | Low risk, stable returns |
| ETFs | 8–15% | Depends on underlying index or sector |
| Cryptocurrencies | 50–80% | Extremely volatile; SD may not capture tail risk |
| Commodities (Gold, Oil) | 10–15% | Moderate risk; hedge against inflation |
Consider two equities, Share X and Share Y, both with an average annual return of 8%.
Share X has a standard deviation of 12%
Share Y has a standard deviation of 6%
Although their average returns are identical, Share X’s returns fluctuate twice as much as Share Y’s. A conservative investor might prefer Share Y’s steadiness, while a risk-seeking trader could favor Share X for its potential upside.
Standard deviation allows for direct comparison of risk across different investments, regardless of asset class. It is especially useful when considering funds, ETFs, or portfolios, as it provides a single number summarising the variability of returns.
| Investment | Average Annual Return | Standard Deviation | Risk Profile | Notes |
|---|---|---|---|---|
| Large-Cap US Stock (S&P 500) | 8% | 15% | Moderate | Highly liquid, historically stable |
| Tech Mid-Cap ETF | 12% | 22% | High | Higher volatility, potential for larger gains |
| US Treasury Bond | 4% | 5% | Low | Stable income, low volatility |
| Crypto (BTC) | 10% | 65% | Very High | Extreme swings, suitable only for risk-tolerant investors |
However, the SD should be used alongside other metrics, such as beta or the Sharpe ratio, for a more comprehensive view of risk.
Assumes Normal Distribution: Real-world returns often exhibit skewness and fat tails.
Ignored Direction: Treats upside and downside equally, though investors care more about losses.
Sensitive to Outliers: Extreme events (e.g., black swan events) can distort SD.
Historical Measure: Past SD may not predict future volatility, especially in fast-changing markets.
Practical implication
SD should be used alongside beta, Sharpe ratio, Value-at-Risk (VaR), or stress testing for a complete risk picture.
Extreme events, known as “black swans”, can occur more frequently than predicted by a normal distribution, leading to underestimation of risk. Standard deviation treats upside and downside volatility equally, even though investors are typically more concerned about losses.
There’s no universal “good” SD as it depends on your risk tolerance. Generally, large-cap stocks average around 12–15%, which is considered moderate. Anything above 25% is high volatility, suitable only for active or risk-tolerant investors.
Most traders monitor SD daily or weekly, depending on their strategy. Short-term traders may rely on rolling 20-day or 30-day SD to adjust position size and stop-loss levels.
Not directly. However, sudden spikes in SD often indicate stress, uncertainty, or speculative bubbles. It can act as an early warning signal, but not as a predictive tool on its own.
Standard deviation is a fundamental tool for assessing volatility and investment risk. By quantifying how much returns deviate from their average, it allows investors to compare assets objectively, identify potential risks, and make informed decisions.
When applied thoughtfully alongside other risk metrics like beta or the Sharpe ratio, standard deviation helps investors construct portfolios that align with their risk tolerance, investment goals, and long-term financial strategy.
Disclaimer: This material is for general information purposes only and is not intended as (and should not be considered to be) financial, investment or other advice on which reliance should be placed. No opinion given in the material constitutes a recommendation by EBC or the author that any particular investment, security, transaction or investment strategy is suitable for any specific person.