Mean reversion trading offers a systematic approach to capitalising on price deviations. By understanding the underlying principles and employing appropriate strategies, traders can enhance their chances of success.
However, like all trading strategies, it requires discipline, risk management, and continuous learning.
In the sections below, we delve into how mean reversion trading works, the tools traders use, and practical examples to illustrate each strategy.
How Mean Reversion Trading Exploits Market Overreactions
In a market where prices swing wildly, driven by emotions, news, or short-term events, prices often stray far from their intrinsic value, creating opportunities for traders.
Mean reversion trading capitalises on this tendency, betting that prices will eventually return to their historical averages.
For instance, consider a stock that has surged due to a temporary event. A mean reversion trader might anticipate that, once the excitement subsides, the stock's price will decline back to its mean.
This strategy is particularly effective in range-bound markets where prices oscillate between support and resistance levels.
Decoding the Patterns: The Science Behind Mean Reversion Trading
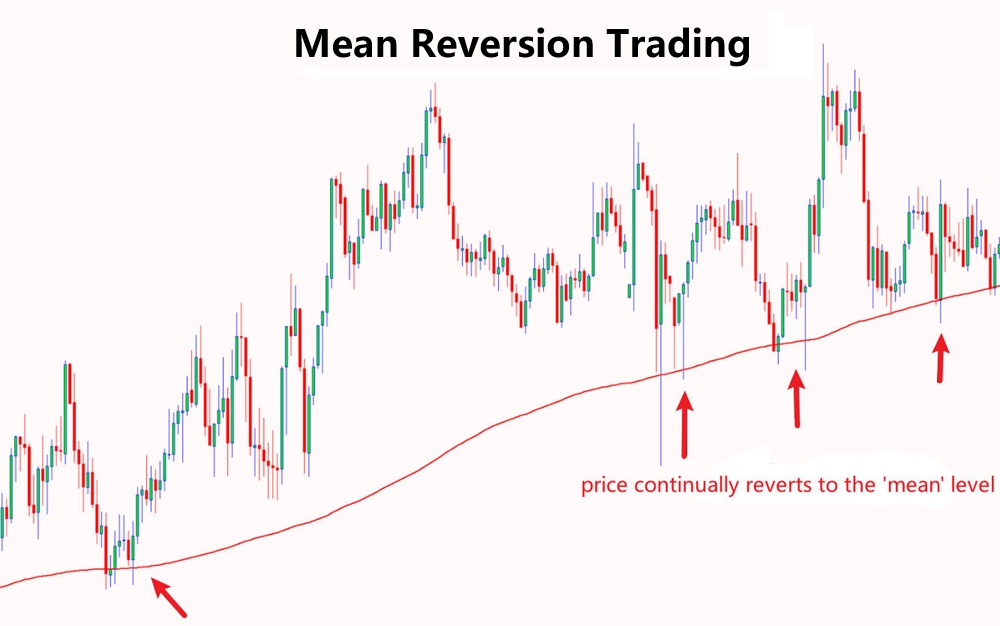
At its core, mean reversion trading is grounded in the statistical theory that asset prices and returns eventually revert to their long-term mean or average level. This concept is widely used in various financial time series data, including price, earnings, and book value.
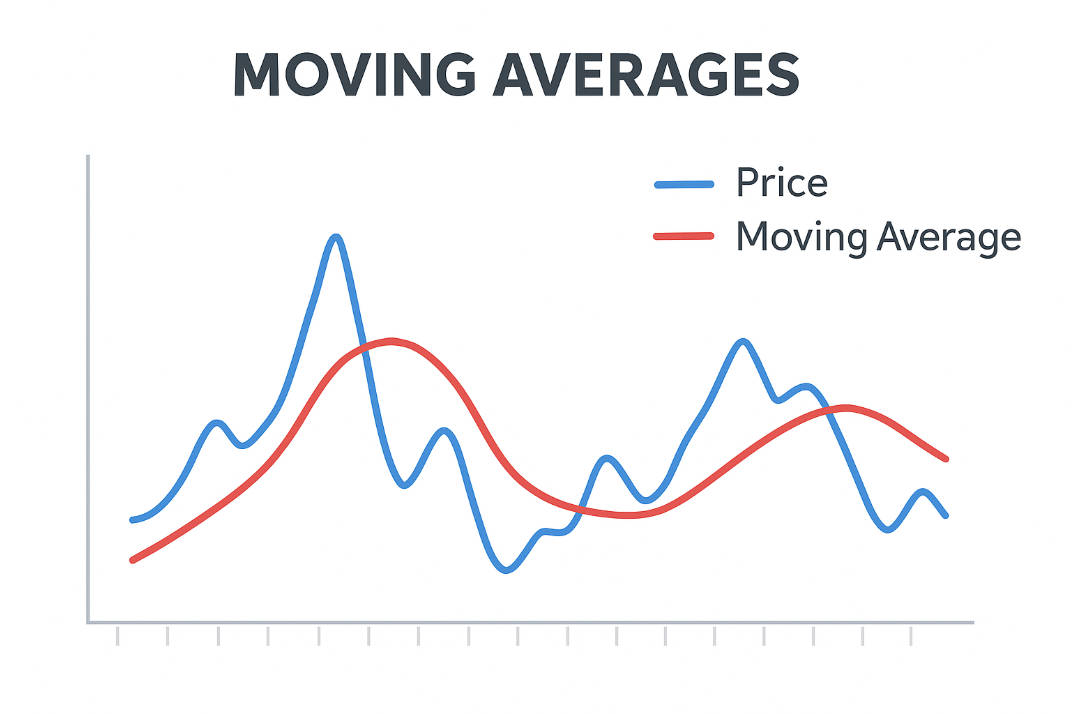
Traders employ several indicators to identify mean reversion opportunities:
Spotting the Signals: Key Strategies in Mean Reversion Trading
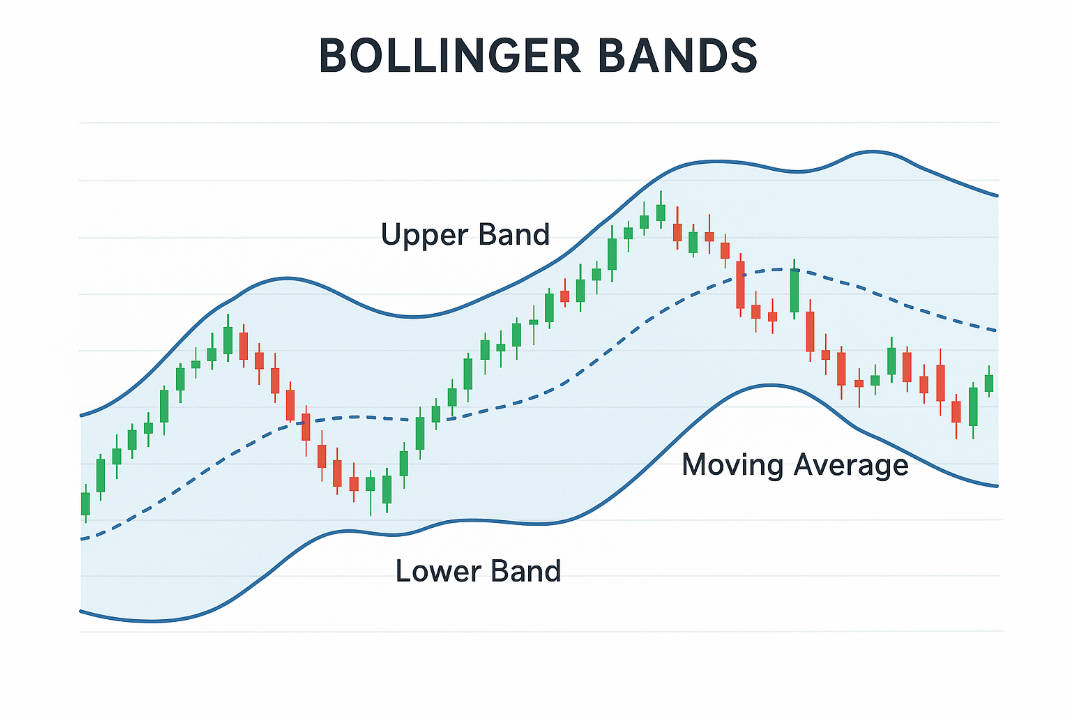
1) Bollinger Bands
Bollinger Bands consist of a middle band (SMA) and two outer bands set two standard deviations away from the middle band. When prices touch or exceed these outer bands, it suggests that the asset is overbought or oversold, presenting a potential mean reversion opportunity.
2) Relative Strength Index (RSI)
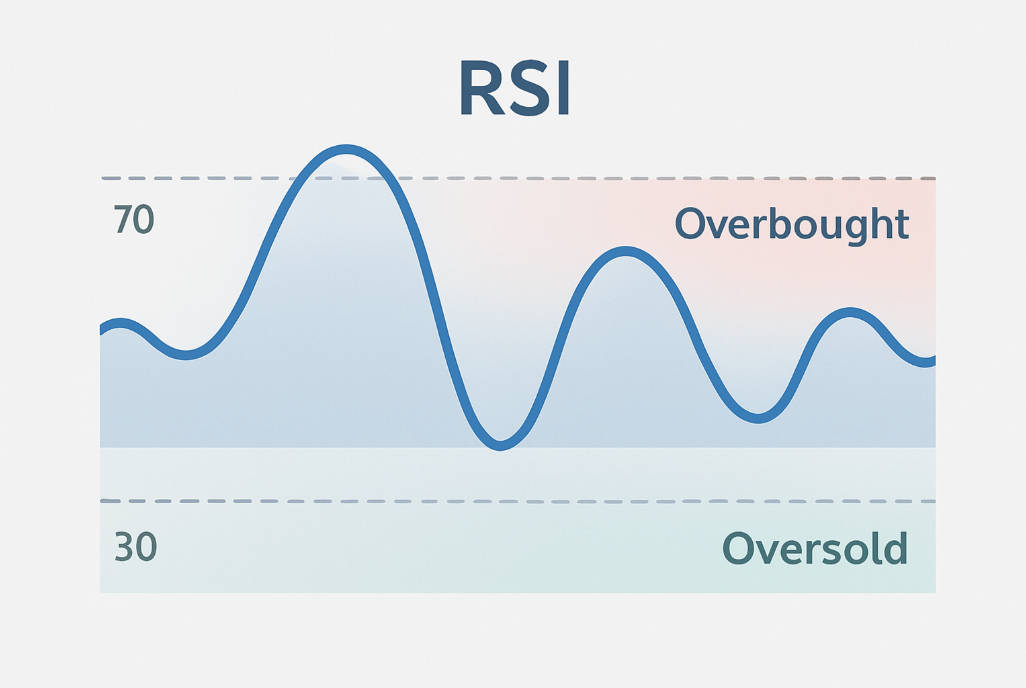
The RSI oscillates between 0 and 100. A value above 70 indicates that the asset is overbought, while below 30 suggests it is oversold. Traders look for reversals when the RSI moves back towards the 50 level.
3) Pairs Trading
This strategy involves taking opposite positions in two correlated assets. When the price relationship deviates from the historical mean, traders go long on the underperforming asset and short on the outperforming one, anticipating that the spread will revert to its mean.
4) Statistical Arbitrage
This involves using quantitative models to exploit mean reversion opportunities across a portfolio of assets. By identifying mispriced securities that are expected to revert to their mean, traders can profit from these inefficiencies.
Guardrails for Success: Risk Management in Mean Reversion Trading
While mean reversion strategies can be profitable, they come with risks:
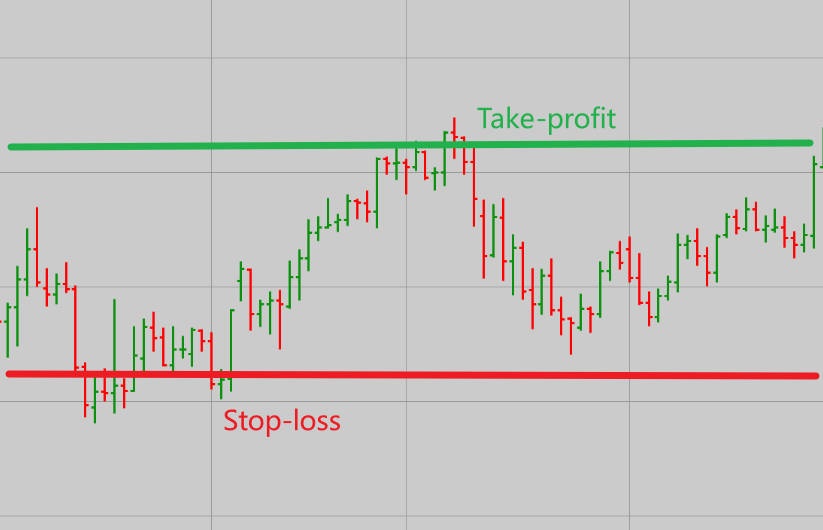
Setting appropriate stop-loss orders can prevent significant losses if the price continues to move against the position. Take-profit levels should be set to lock in gains when the price reverts to the mean.
Mean reversion strategies may underperform in trending markets where prices move away from the mean for extended periods.
The contrarian nature of mean reversion trading can be psychologically challenging. Traders must maintain discipline and stick to their strategies.
Backtesting and Validation:
Before implementing a mean reversion strategy, it's crucial to backtest it on historical data to ensure its effectiveness.
Taking It Up a Notch: Advanced Techniques in Mean Reversion Trading
For experienced traders looking to enhance their mean reversion strategies:
Machine Learning Models: These can predict mean reversion opportunities by analysing large datasets and identifying patterns that human traders might miss.
Reinforcement Learning: This type of machine learning allows models to learn optimal trading strategies through trial and error, improving over time.
Real-Time Data Analysis: Incorporating high-frequency data can provide timely signals for mean reversion trades, allowing for quicker reactions to market changes.
Learning from the Masters: Real-World Mean Reversion Trading Examples
Case Study 1: S&P 500 Post-Correction Rebounds
After significant market corrections, the S&P 500 often experiences mean reversion, bouncing back to its long-term average. Traders who identified these opportunities could have profited from the subsequent rallies.
Case Study 2: Forex Examples
Currency pairs like EUR/USD and USD/JPY frequently exhibit mean-reverting behaviour. For instance, after sharp movements due to economic data releases, these pairs often revert to their mean levels.
Case Study 3: Crypto Volatility Plays
Cryptocurrency markets are known for their volatility. Traders who capitalised on mean reversion during periods of extreme price movements could have realised substantial gains.
Frequently Asked Questions (FAQ)
Q1: What is mean reversion trading?
Mean reversion trading is a strategy that assumes asset prices will return to their historical average over time. Traders identify when prices deviate significantly from this mean and take positions expecting a reversal.
Q2: Which indicators are best for mean reversion trading?
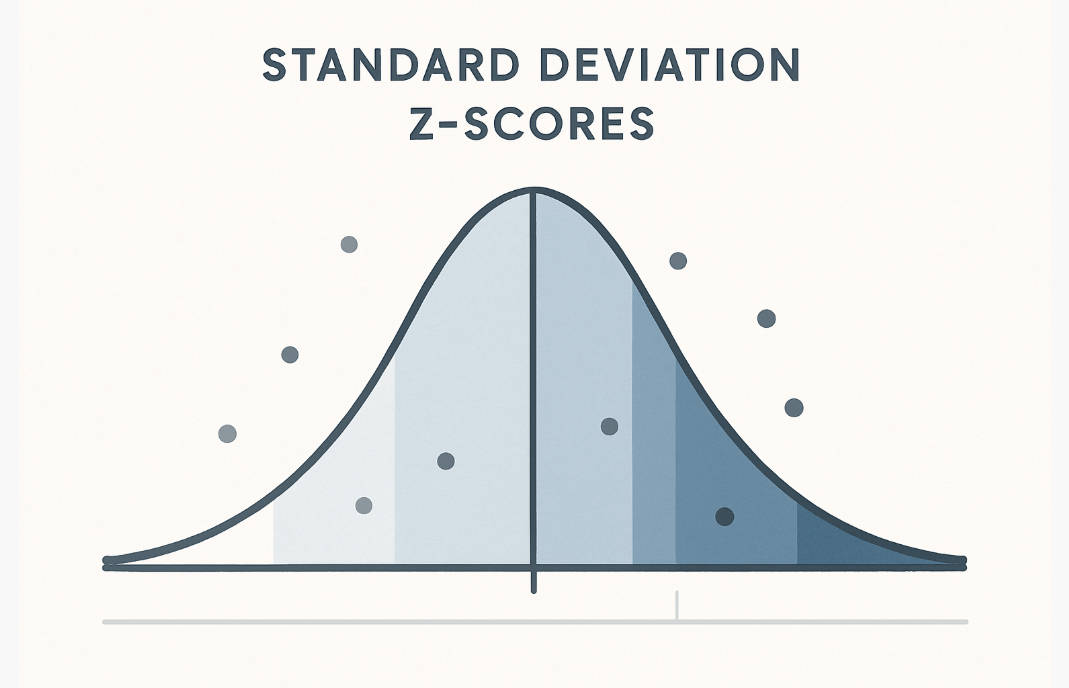
Commonly used indicators include moving averages, Bollinger Bands, RSI, and statistical measures like standard deviation and Z-scores.
Q3: Is mean reversion trading suitable for all markets?
While effective in range-bound markets, mean reversion strategies may underperform in trending markets where prices move away from the mean for extended periods.
Q4: How can I manage risk in mean reversion trading?
Implementing stop-loss orders, setting take-profit levels, and diversifying positions can help manage risk. It's also crucial to backtest strategies before live trading.
Q5: Can machine learning improve mean reversion trading?
Yes, machine learning models can analyse large datasets to identify mean reversion opportunities, potentially enhancing the effectiveness of trading strategies.
Conclusion
Mean reversion trading transforms market overreactions into actionable opportunities. By spotting when prices stray too far from their average, traders can enter with confidence and exit strategically. Success hinges on discipline, risk management, and a clear strategy.
Whether using simple indicators or advanced quantitative tools, understanding the rhythm of the market allows traders to navigate volatility and capture profitable reversals. With patience and precision, mean reversion trading turns price swings into consistent, data-driven opportunities.
Disclaimer: This material is for general information purposes only and is not intended as (and should not be considered to be) financial, investment or other advice on which reliance should be placed. No opinion given in the material constitutes a recommendation by EBC or the author that any particular investment, security, transaction or investment strategy is suitable for any specific person.
