Published on: 2025-09-09
Updated on: 2025-09-09
XABCD patterns help traders harness harmonic moves by using Fibonacci ratios to identify potential reversal zones, giving structured entry, stop-loss, and profit targets for disciplined trading.

The world of trading is filled with recurring formations that, when recognised and interpreted correctly, can provide powerful clues about future price movements. Among the most sophisticated of these is the XABCD pattern, a five-point harmonic formation rooted in Fibonacci mathematics.
This pattern is not merely a visual curiosity. It has its foundations in harmonic trading, an approach popularised by H.M. Gartley in the 1930s. By combining geometry, ratios, and price structure, the XABCD pattern helps traders anticipate potential turning points with remarkable accuracy.
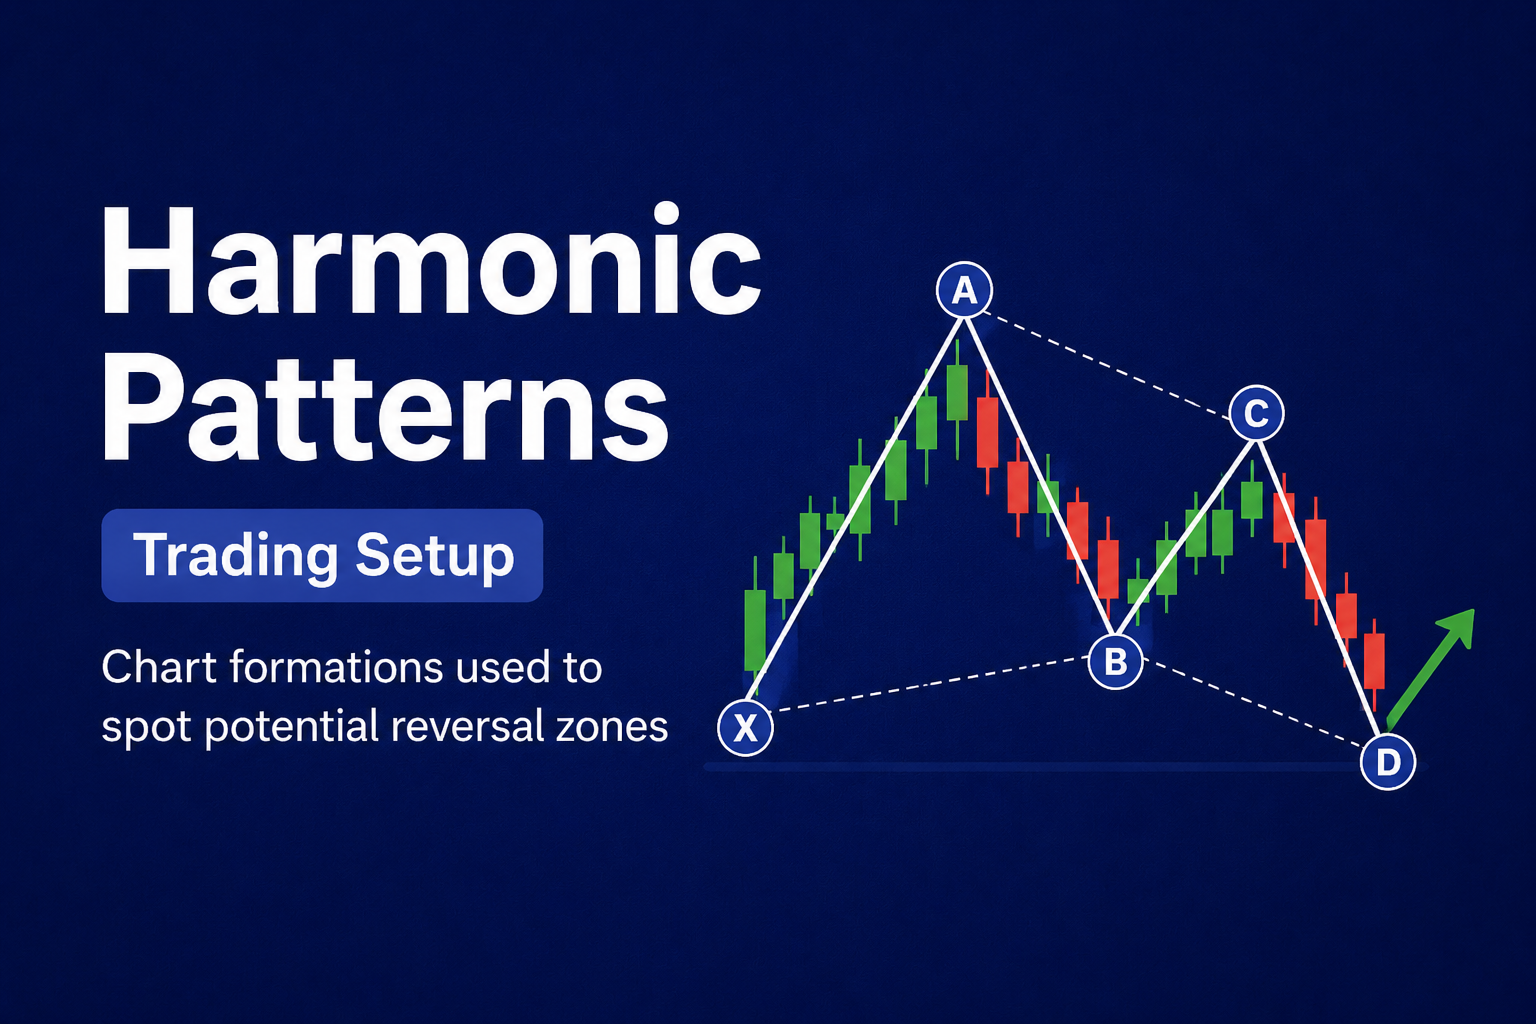
At its core, the XABCD pattern consists of five key points – labelled X, A, B, C, and D – joined by four consecutive legs: XA, AB, BC, and CD. While the geometry of the pattern may appear simple, its real power lies in the precise Fibonacci relationships between these legs.
The XABCD pattern begins with point X, from which the first leg (XA) is formed. Subsequent swings establish points A, B, and C, leading to the final leg CD, which ends at D – the critical point signalling a potential reversal or continuation.
Each leg is defined by specific Fibonacci retracement or extension ratios. For instance:
AB is typically a retracement of XA.
BC retraces a portion of AB.
CD is usually the longest move and represents an extension of BC.
It is important to note that in real markets, these ratios rarely match the "ideal" numbers perfectly. Instead, traders work within acceptable ranges, allowing for flexibility while maintaining structural integrity.

Over time, traders have identified several recognised variations of the XABCD structure, each with its own Fibonacci rules. The most common include:
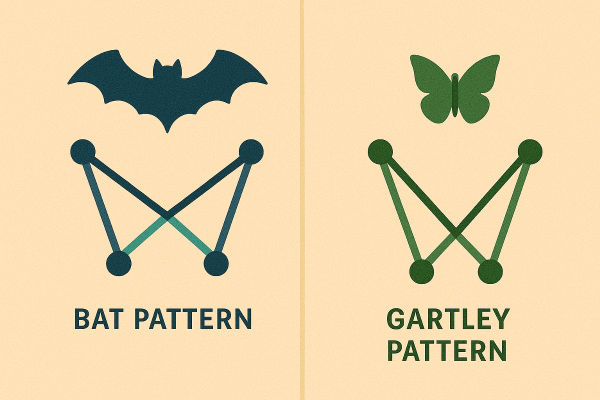
1) The Gartley Pattern
Often regarded as the "classic" harmonic formation. It occurs frequently and provides balanced risk-to-reward opportunities. Typically, AB retraces about 61.8% of XA, and CD retraces 78.6% of XA.
2) The Butterfly Pattern
Distinguished by a deep retracement of XA, with point D extending well beyond X. The CD leg often extends to 127%–161% of XA, making it a strong reversal candidate.
3) The Crab Pattern
Recognised for its extreme precision, the Crab's CD leg can stretch up to 161.8% of XA, offering powerful reversal signals but demanding strict risk management.
4) The Bat Pattern
Known for its conservative structure, the Bat ends at 88.6% retracement of XA, creating a strong but less aggressive reversal opportunity compared to the Crab or Butterfly.
Each variant has unique features, but the unifying principle is the use of Fibonacci measurements to validate the setup.
Recognising XABCD patterns in live markets requires patience and practice. Traders typically use two approaches:
1) Manual Identification
By studying swing highs and lows, traders connect points to form potential XABCD structures. This method requires experience and an eye for proportion.
2) Automated Detection
Platforms such as TradingView and dedicated scanners offer automated tools that identify XABCD patterns based on pre-set Fibonacci rules. These reduce human error and save considerable time.
The most critical stage is point D, which serves as the potential entry zone. Traders look for confirmation signals – such as candlestick patterns, momentum divergences, or indicator alignment – before committing to a trade.

The XABCD pattern is not a trading system in isolation. To make it effective, traders must develop a structured strategy that includes entries, exits, and risk controls.
Entry Point: Typically at point D, once price action confirms a potential reversal. Indicators like the RSI or MACD can add confidence.
Stop-Loss Placement: Commonly placed beyond point X, providing a buffer against false signals.
Take-Profit Levels: Often set at prior swing points, such as C or A, depending on the pattern type and market conditions.
While the pattern can be used on any timeframe, higher charts such as the four-hour or daily tend to produce more reliable setups. This makes the XABCD suitable for a wide range of markets, including forex, equities, and cryptocurrency.
Advantages:
Provides a rule-based, objective framework for spotting opportunities.
Can be automated using modern charting platforms.
Helps define clear risk zones, which is critical for disciplined trading.
Challenges:
The learning curve is steep, particularly for beginners.
Patterns often deviate from perfect ratios, requiring subjective judgement.
Without proper confirmation tools, false signals can mislead traders.
Therefore, while the XABCD pattern is powerful, it must be integrated into a broader trading plan rather than used in isolation.
Experienced traders often classify XABCD formations into categories beyond the traditional harmonic patterns:
Retracement Time Patterns (RTP): Where point D falls within the XA range.
Extension Time Patterns (ETP): Where D extends beyond X, offering higher risk and reward potential.
X-Point Time Patterns (XTP): A more specialised variation, focusing on the timing relationship to point X.
Moreover, advanced practitioners combine time analysis, market cycles, and frequency studies with harmonic ratios to strengthen reliability. This multi-dimensional approach transforms the XABCD pattern from a simple shape into a comprehensive analytical tool.
The XABCD pattern remains one of the most versatile and respected tools in harmonic trading. By blending Fibonacci ratios with geometric price structure, it offers traders a roadmap for identifying potential reversal and continuation zones.
While not foolproof, it provides clarity, objectivity, and discipline – qualities essential to long-term trading success. Those willing to invest the effort in mastering the nuances of XABCD will find it a powerful ally in navigating the complexities of modern markets.
1. What defines a valid XABCD pattern?
A valid pattern consists of five points – X, A, B, C, and D – connected by four legs. Each leg must adhere to specific Fibonacci retracement or extension rules, although in real markets, traders allow for small variations within acceptable ranges.
2. Which XABCD variant is the most reliable?
The Gartley pattern is widely considered the most reliable due to its balanced structure and frequent occurrence across markets. However, reliability also depends on timeframe, market conditions, and confirmation signals.
3. How should I manage risk when trading XABCD patterns?
Risk is best managed by placing a stop-loss near or beyond point X, as this invalidates the pattern if breached. Profits can be taken at point C or A, depending on the specific setup. Position sizing and additional confirmations further reduce risk.
4. Can XABCD patterns be automated?
Yes. Charting platforms such as TradingView and specialised scanners allow automated identification of harmonic patterns, including XABCD. These tools are particularly helpful for reducing human error and scanning multiple instruments simultaneously.
Disclaimer: This material is for general information purposes only and is not intended as (and should not be considered to be) financial, investment or other advice on which reliance should be placed. No opinion given in the material constitutes a recommendation by EBC or the author that any particular investment, security, transaction or investment strategy is suitable for any specific person.