Published on: 2026-04-27
Updated on: 2026-04-27
A bear steepener and a bull steepener both describe a steeper yield curve, but they do not send the same market signal.
A bear steepener happens when long-term yields rise faster than short-term yields. This usually puts long-duration bonds under pressure because bond prices fall when yields rise. A bull steepener happens when short-term yields fall faster than long-term yields. This often reflects expectations for easier monetary policy, weaker growth, or future rate cuts.
For investors, the difference matters. Yield curve steepening can affect bond prices, equity valuations, bank margins, mortgage rates, real estate pricing, and portfolio duration risk.

A bear steepener occurs when long-term yields rise faster than short-term yields.
A bull steepener occurs when short-term yields fall faster than long-term yields.
Bear steepeners often reflect stronger growth, sticky inflation, higher term premiums, or heavier long-term bond supply.
Bull steepeners often reflect rate-cut expectations, weaker growth, or rising recession risk.
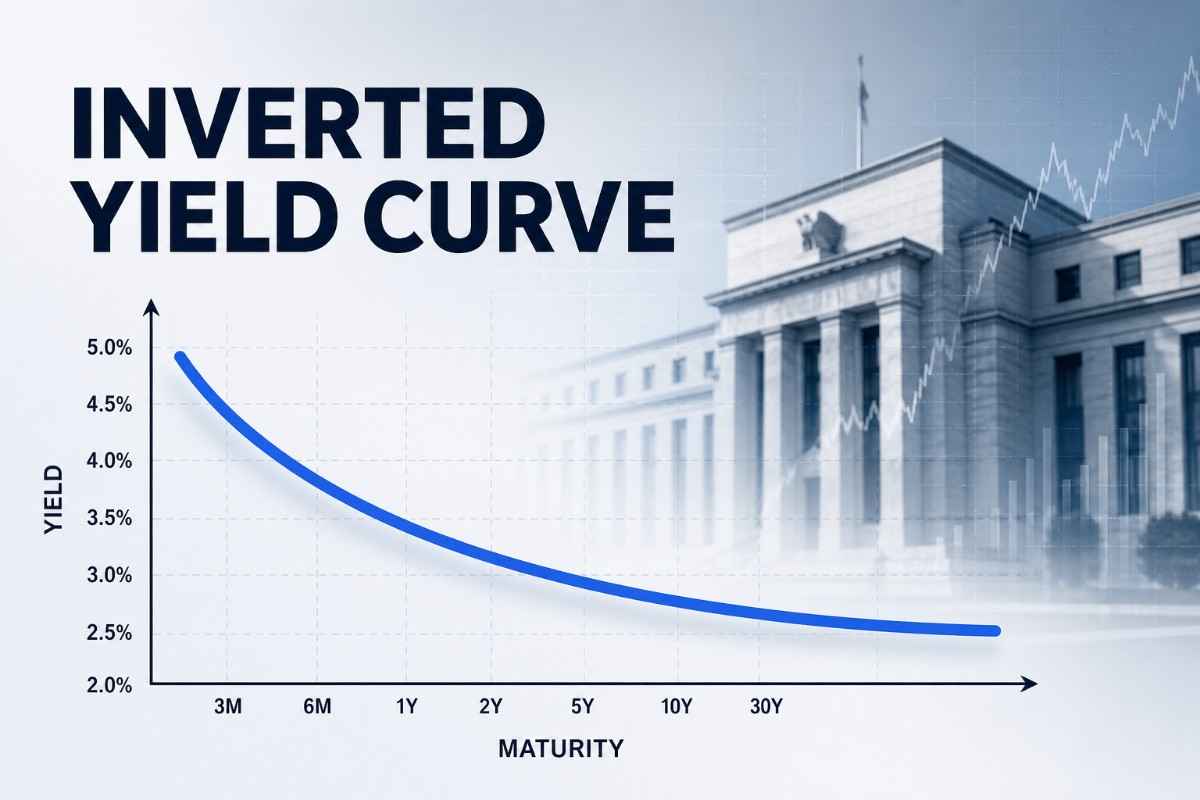
The 2-year and 10-year yield spread, also called the 2s10s spread, is one of the simplest ways to track whether the yield curve is steepening.
The yield curve shows interest rates across bond maturities, from short-term bills to long-term bonds. Investors often watch the spread between 2-year and 10-year government bond yields because it captures the relationship between policy-sensitive short-term rates and growth-sensitive long-term rates.
The 2s10s spread is calculated as 10-year yield minus 2-year yield
A curve steepens when the gap between short-term and long-term yields widens. That can happen in two main ways:
Long-term yields rise faster, creating a bear steepener.
Short-term yields fall faster, creating a steepening of the yield curve.
The chart shape can look similar, but the message is different. A bear steepener points to rising long-term borrowing costs. A bull steepener points to falling short-term policy-rate expectations.
A bear steepener happens when long-term interest rates rise faster than short-term interest rates.
The term “bear” refers to bonds. Bond prices move inversely to yields, so rising yields usually mean falling bond prices. In a bear steepener, longer-dated bonds tend to suffer the most because they are more sensitive to changes in interest rates.
Bear steepeners often appear when investors demand more compensation for inflation risk, stronger nominal growth, fiscal deficits, or heavier long-term bond issuance. They can also appear when the market expects the term premium to rise.
In this example, the 2-year yield rises by 10 basis points, while the 10-year yield rises by 70 basis points. The curve steepens because the long end rises much faster than the short end.
This is a bear steepener because yields are rising, and the larger move is happening in long-term rates. For investors, this is usually a warning that the market is repricing long-term borrowing costs.
A bull steepener happens when short-term interest rates fall faster than long-term interest rates.
The term “bull” also refers to bonds. Falling yields usually mean rising bond prices. In a bull steepener, short-term bonds often rally as markets price in central bank rate cuts.
Bull steepeners often appear when investors expect easier policy, slower growth, or future cuts in short-term interest rates. The signal can be positive if rate cuts support a soft landing. It can be negative if the move reflects rising recession risk.
In this example, the 2-year yield falls by 90 basis points, while the 10-year yield falls by only 20 basis points. The curve steepens because short-term yields decline more quickly than long-term yields.
This is a bull steepener because yields are falling, with the larger move at the short end of the curve.

The key difference is direction. A bear steepener is driven by rising yields. A bull steepener is driven by falling yields. Both steepen the curve, but they tell investors different things about growth, inflation, policy, and risk appetite.
Bear steepeners are difficult for long-duration bonds. When 10-year or 30-year yields rise sharply, bond prices fall, and longer maturities usually absorb the largest losses.
Bull steepeners tend to favour short-term bonds because they benefit directly from falling policy-rate expectations. Longer-term bonds may also gain, but their reaction depends on inflation expectations, term premium, and bond supply.
A bear steepener can pressure equities by lifting discount rates. Growth stocks are usually more sensitive because a larger share of their value comes from expected future earnings.
A bull steepener is more conditional. If lower short-term yields signal a soft landing, equities may benefit from easier financial conditions. If the move reflects recession risk, earnings downgrades can offset the valuation support.
Banks often prefer a steeper curve because traditional banking models involve borrowing short and lending long. A bear steepener can improve lending margins if growth remains solid, deposit costs stay controlled, and credit losses remain contained.
A bull steepener is less straightforward. Lower funding costs can help, but recession risk can weaken loan demand, squeeze profitability, and increase defaults.
Real estate often struggles during a bear steepener because higher long-term yields can lift mortgage rates, refinancing costs, and required returns. Publicly traded real estate investment trusts, or REITs, can also face valuation pressure when discount rates rise.
A bull steepener can help financing conditions, but only if weaker growth does not damage rents, occupancy, credit availability, or asset values.
The curve shape is only the first signal. The driver matters more.
Investors should ask three questions:
Are long-term yields rising because inflation risk or bond supply pressure is increasing?
Are short-term yields falling because central banks are preparing to cut rates?
Is the curve steepening because growth is improving or because recession risk is increasing?
A bear steepener usually tells investors to watch duration exposure, growth-stock valuations, mortgage rates, and other rate-sensitive sectors.
A bull steepener usually tells investors to watch central bank expectations, credit conditions, earnings momentum, and recession signals.
The most practical indicator is the 2s10s spread. When the spread widens, the curve steepens. When the spread narrows, the curve flattens.
A bear steepener is usually challenging for bond investors because long-term bond prices fall as yields rise. For equity investors, the impact depends on why yields are rising. Higher yields linked to healthy growth can be easier to absorb than those linked to inflationary pressures or fiscal stress.
It is called a bear steepener because rising yields are bearish for bonds. Bond prices fall when yields rise. The curve steepens because long-term yields rise faster than short-term yields, widening the maturity spread.
A bull steepener can help stocks if investors believe rate cuts will support growth and liquidity. It can hurt stocks if the move reflects recession risk, weaker earnings expectations, or rising credit stress. The macro backdrop decides the market reaction.
The 2-year and 10-year government bond spread is one of the most widely used measures. It captures the relationship between policy-sensitive short-term rates and growth-sensitive long-term rates. A widening spread signals steepening, while a narrowing spread signals flattening.
Yes. A cycle can begin with a bear steepener if inflation or fiscal concerns push long-term yields higher. Later, if growth weakens and markets expect rate cuts, short-term yields may fall quickly, turning the move into a bull steepener.
A bear steepener and a bull steepener both describe a steeper yield curve, but they are not the same signal.
A bear steepener reflects rising long-term yields and often points to inflation, growth, term premium, or fiscal pressure. A bull steepener reflects falling short-term yields and often points to easier policy, weaker growth, or recession risk.
For investors, the value lies in interpretation. The curve shows what is moving. The driver explains why it matters.