Published on: 2026-01-28
The Inverse Cramer Strategy has evolved from a retail meme into a well-defined contrarian framework that seeks to profit from the market impact of Jim Cramer’s public stock recommendations. Its importance is not rooted in ridiculing a television figure.
The strategy addresses how attention shocks, narrative crowding, and reflexive flows can distort short-term asset pricing, particularly when media amplification leads to coordinated buying or selling. In markets where sentiment often outpaces fundamentals, the term “inverse” serves as a concise reference to contrarian positioning against prevailing consensus at its peak.
Retail interest eventually led to two actively managed exchange-traded funds (ETFs): the Inverse Cramer Tracker ETF (SJIM) and the Long Cramer Tracker ETF (LJIM).
The Inverse Cramer Strategy should be interpreted as a media-driven contrarian signal rather than an assertion that any individual commentator is consistently incorrect.
The primary advantage of the strategy derives from the Cramer effect, in which attention shocks induce short-term price pressure that subsequently mean-reverts.
ETF implementations such as SJIM and LJIM demonstrated that fees, execution frictions, and unintended factor exposures can undermine the effectiveness of an otherwise compelling strategy.
Fundamentally, the Inverse Cramer Strategy involves taking positions opposite to Jim Cramer’s publicly stated views. In practice, investors employ three distinct variants, though only one demonstrates consistent coherence.
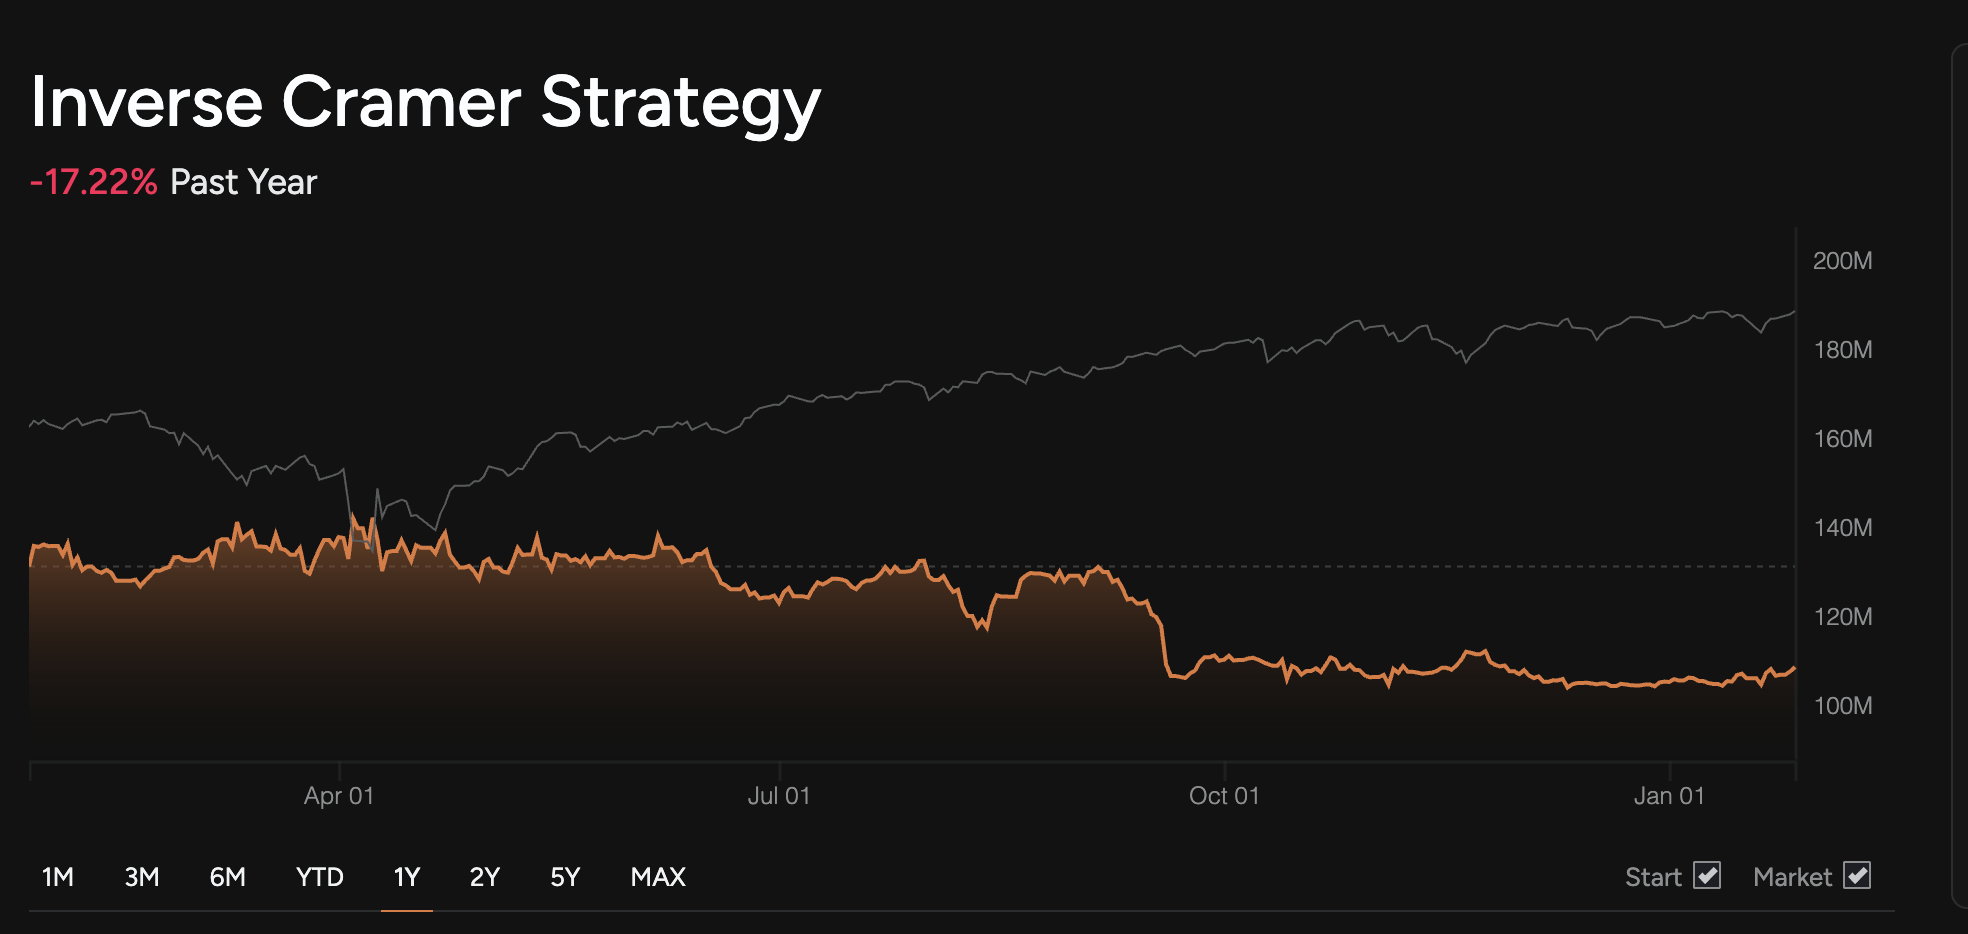 1) The meme trade: “do the opposite” in real time
This is the version popularised on social platforms and finance forums, often bundled with phrases like “Cramer curse” or “Cramer indicator.” It treats every bullish call as a sell and every bearish call as a buy. The problem is that Cramer’s commentary spans time horizons, position sizing, and changing evidence. Without rules, the “inverse Jim Cramer strategy” becomes selective memory with a brokerage account.
A rules-based approach uses a basket of Cramer-referenced securities and trades them on a set schedule. A common method is to short Cramer’s most-mentioned tickers over a defined window, hedge with a broad-market index, and rebalance weekly with equal weights. This turns commentary into a repeatable and testable trading signal.
This variant is the institutional view. It does not assume the recommendation is wrong but expects the market reaction to overshoot due to concentrated attention. Afterwards, prices may normalise. Research on Mad Money shows short-term movements around recommendations followed by reversals, consistent with price pressure. Limited arbitrage opportunities exist. opportunities.
The third variant is where “inverse” stops being a joke and becomes a microstructure hypothesis.
Televised stock recommendations function as high-intensity distribution events rather than traditional research notes. When a segment gains viral traction, it can generate a synchronised demand shock among viewers and social media followers, particularly in less liquid securities where price impact is more pronounced.

The “Cramer effect” is the measurable market reaction to Mad Money recommendations. Multiple studies document statistically significant announcement-period returns and volume changes around recommendations, with patterns consistent with attention-driven buying pressure rather than durable information content.
The most cited findings show the initial move can partially reverse over subsequent weeks or months, especially after buy recommendations.
This matters because contrarian trading often fails when it is simply “opinion versus opinion.” It works more reliably when it is “flow versus liquidity.” Inverse Cramer, at its best, is a liquidity-and-attention trade dressed in cultural language.
The strategy’s peak legitimacy arrived with two actively managed ETFs launched by Tuttle Capital Management: one designed to track Cramer's positive recommendations (LJIM) and one designed to do the opposite (SJIM). Both ultimately closed, which provides a real-world stress test of the concept.

SJIM (Inverse Cramer Tracker ETF): Public reporting stated the fund would stop trading on 13 February 2024 and liquidate shortly after; reported assets were about $2.4 million.
LJIM (Long Cramer Tracker ETF): Public reporting stated the fund would halt trading on 11 September 2023 and liquidate on 21 September 2023; reported assets were about $1.3 million.
| Product | Ticker | Concept | Reported assets around closure (approx.) | Net expense ratio (after waiver) | Closure timeline (public reporting) | Outcome |
|---|---|---|---|---|---|---|
| Inverse Cramer Tracker ETF | SJIM | Opposite side of Cramer-linked recommendations (before fees and expenses) | ~$2.4M | ~1.20% | Stopped trading 13 Feb 2024; liquidated shortly after | Closed and liquidated |
| Long Cramer Tracker ETF | LJIM | Tracks Cramer-linked recommendations (before fees and expenses) | ~$1.3M | ~1.20% | Halted trading 11 Sep 2023; liquidated 21 Sep 2023 | Closed and liquidated |
The key insight is not that the “inverse” approach failed, but rather that implementing a media-driven signal within an ETF structure encounters significant structural challenges.
These include high turnover, ambiguity in signal translation, hedging costs, and the difficulty of capitalising on narrow timing windows where price-pressure effects are most pronounced.
An effective implementation requires clear decisions regarding signal definition, universe selection, holding period, and risk management. Absent these elements, the strategy risks devolving into mere entertainment rather than a disciplined investment approach.
ETF and backtesting frameworks typically limit inclusion to explicit buy or sell recommendations, excluding casual mentions. Systematic models often focus on the most-recommended tickers over a recent window to minimise noise.
The inverse strategy is particularly vulnerable in illiquid securities, where bid-ask spreads widen, and borrowing costs can become prohibitive. Implementing liquidity screens based on market capitalisation, average daily dollar volume, and borrow availability is essential.
Event-driven fade: short-term, focused on the post-attention overshoot and early reversal window.
Basket rebalance: medium-term, using weekly rebalance and a rolling lookback window to stabilise exposures.
A naive inverse basket often becomes a hidden bet against momentum or against growth. Many systematic versions hedge with a broad market index to reduce beta and isolate the signal.
| Approach | When it fits | Core rule | Primary risk |
|---|---|---|---|
| Event-driven “Cramer fade” | A specific high-virality call with clear post-call price pressure | Fade the overextension after liquidity normalises, with defined stop and time limit | Gaps, squeezes, headline reversals |
| Systematic inverse basket | You want repeatable rules and measurable behaviour | Define “call” rules, build a basket, rebalance on a schedule, hedge broad beta | Factor drift, turnover and trading costs |
| Overlay indicator | You are not trading short-term, but want a crowding flag | Use mainstream virality as a risk-management input (trim, hedge, tighten stops) | Missing upside in momentum regimes |
The “Jim Cramer indicator” gained traction because Cramer has repeatedly made high-conviction public pivots on Bitcoin at moments when positioning was already emotionally charged. Traders do not treat these moments as predictive in and of themselves.
They treat them as a loudness gauge: when a mainstream megaphone turns decisively bullish or bearish, the trade can already be crowded, and crowded crypto trades often unwind through leverage and liquidity.
Real-world examples that crypto traders reference:
June 2021 (rotation call): Business reporting quotes Cramer describing a shift from Bitcoin toward Ethereum, linked to Bitcoin holding around $30,000. (Source accessed 28 Jan 2026.)
December 2022 (capitulation tone): Reporting quotes Cramer urging investors to exit crypto, including the line “never too late to sell an awful position,” during a period when Bitcoin was trading around the mid-$17,000s. (Source accessed 28 Jan 2026.)
November 2023 (walk-back): Reporting quotes Cramer saying he was “premature” and “If you like Bitcoin, buy Bitcoin.” (Source accessed 28 Jan 2026.)
January 2024 (ETF-era caution): Reporting quotes Cramer saying, “Bitcoin is topping out.” (Source accessed 28 Jan 2026.)
Cramer’s commentary is interpreted as an attention shock rather than a direct trade signal. Execution is considered only when market positioning indicates crowding, such as stretched funding rates, open interest rising faster than spot prices, and implied volatility failing to reflect reversal risk.
Treat Cramer’s commentary as an attention shock, not as a standalone trade signal. If you choose to act, define objective filters that indicate crowding and fragility (for example: leverage building faster than spot, funding and basis stretched, and options pricing that does not reflect reversal risk).
When those conditions align, the “inverse” approach becomes a risk-defined setup, not a superstition.
Confusing entertainment with signal. Not every mention is actionable. Rules must distinguish between explicit recommendations and contextual discussion.
Ignoring borrowing and financing. Shorting is not free. Borrow rates, hard-to-borrow constraints, and recall risk matter more than the headline.
Overtrading the noise. The strategy’s edge, when present, is about a specific attention event or a stabilised basket framework. Constant reaction trading produces slippage and poor expectancy.
Mistaking factor cycles for skill. Inverse baskets can accidentally short the strongest factor in the market. A momentum-led bull phase can make “inverse” look broken for long stretches, even if the attention-shock effect still exists at the margin.
The Inverse Cramer Strategy is a contrarian approach that takes positions opposite to Jim Cramer’s public stock calls, often using either event-driven fades of post-recommendation price pressure or systematic baskets of Cramer-linked tickers with a market hedge. Its logic centres on attention shocks and crowded narratives.
Yes. Public reporting stated SJIM would stop trading on 13 February 2024 and liquidate shortly after; reported assets were about $2.4 million around closure.
The Cramer effect refers to measurable price and volume reactions around Mad Money recommendations. A widely cited academic study documents announcement-period reactions and subsequent reversals following buy calls, consistent with short-term price pressure driven by investor attention.
It is not reliably profitable as a blanket rule. The strategy is highly sensitive to implementation, costs, and market regime. Its most durable use is as a sentiment and crowding indicator, or as a tightly defined event-driven trade, not as an always-on signal.
A common systematic structure defines a rolling lookback window, selects a basket of the most-mentioned tickers, rebalances on a fixed schedule (often weekly), and hedges broad-market exposure to control beta. One public example describes shorting Cramer’s 10 most-recommended tickers over the prior 30 days and hedging with a long market index position, with equal weighting and weekly rebalancing. Treat performance figures as hypothetical and execution-sensitive.
The Inverse Cramer Strategy persists because it names a real phenomenon: media can move markets by concentrating attention, and concentrated attention can create short-term mispricings that later mean-revert. The strategy becomes coherent only when it is treated as an attention-shock and crowding framework, with explicit rules, liquidity discipline, and factor-aware hedging.
The closure of SJIM and LJIM showed that monetising the concept at scale is difficult, not that the signal never exists. For most investors, the highest-value application is pragmatic: use “inverse Cramer” as a contrarian indicator that warns when a trade has become crowded, and only express the view when the setup offers defined risk and clear asymmetry.
Disclaimer: This material is for general information purposes only and is not intended as (and should not be considered to be) financial, investment or other advice on which reliance should be placed. No opinion given in the material constitutes a recommendation by EBC or the author that any particular investment, security, transaction or investment strategy is suitable for any specific person.