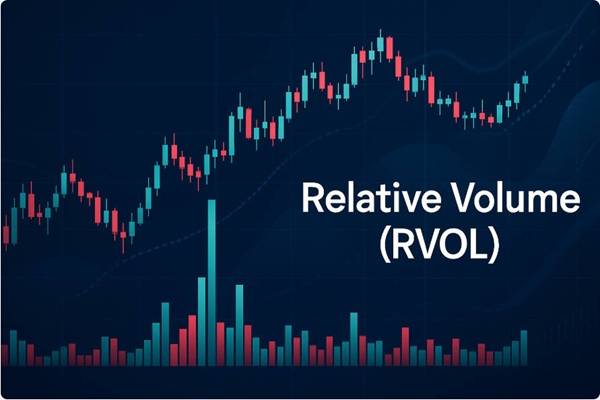
Relative Volume (RVOL) measures how active a stock is compared to its usual trading behaviour — a vital clue to market sentiment and opportunity.
Unlike standard volume, which only shows how many shares are traded, RVOL reveals how significant that activity truly is. It tells traders when a stock is unusually "in play," signalling potential momentum or a major shift in sentiment.
This article breaks down the concept of RVOL, its calculation and interpretation, and how traders can use it strategically — from spotting breakouts and confirming trends to integrating it with other indicators for smarter, more confident trading decisions.
Defining Relative Volume (RVOL): Concept, Calculation, and Interpretation
1. What is Relative Volume (RVOL)?
Relative Volume (RVOL) is a technical indicator that measures a stock's current trading volume relative to its historical average.
For traders, RVOL is an essential tool for determining which stocks are "in play" and where market attention is concentrated.
2. How to Calculate RVOL: Formula and Examples
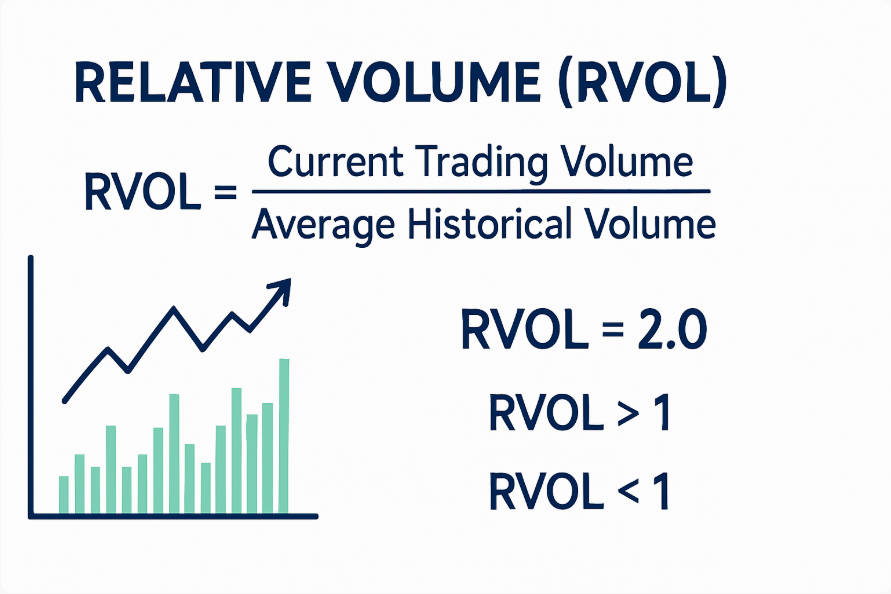
RVOL is calculated using the formula:
RVOL = Current Trading Volume ÷ Average Historical Volume
For instance, if a stock trades 2 million shares today, and its average daily volume over the past 20 days is 1 million shares, the RVOL would be:
RVOL = 2.000.000 ÷ 1.000.000 = 2.0
This indicates that the stock's trading activity is twice its typical level. Traders can use this information to detect sudden market interest, often signalling potential breakouts or heightened volatility.
3. Understanding RVOL Values
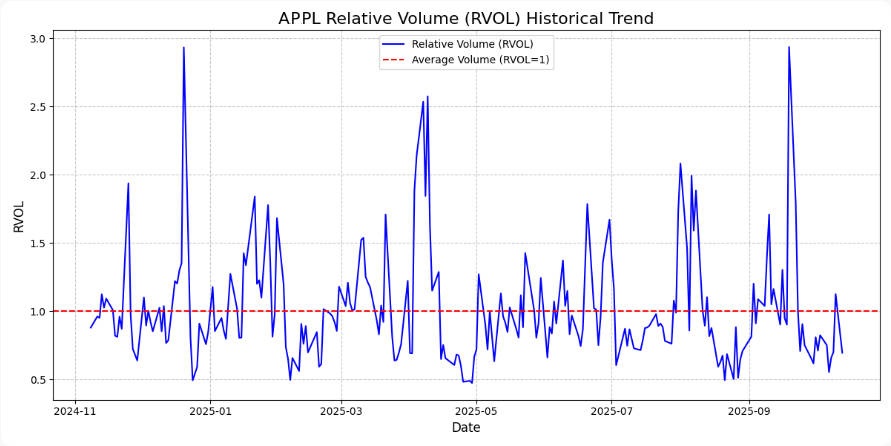
RVOL > 1: Above-average trading activity, suggesting strong market interest.
RVOL < 1: Below-average activity, indicating reduced attention or consolidation.
Extreme RVOL Spikes: Values significantly above 2 or 3 often correspond with news events, earnings releases, or other catalysts.
4. RVOL Compared to Absolute Volume
Absolute volume merely counts shares traded, without considering context. RVOL, however, provides a relative perspective, allowing traders to compare current activity with historical norms. This distinction is crucial for identifying truly significant movements.
The Strategic Importance of RVOL in Stock Analysis
1. RVOL as a Market Sentiment Indicator
A sudden spike in RVOL often coincides with market-moving events such as corporate announcements or macroeconomic news. High RVOL reflects heightened investor attention and can indicate bullish or bearish sentiment depending on the price movement.
2. Using RVOL to Confirm Price Trends
RVOL can serve as a confirmation tool for trends. Rising prices accompanied by high RVOL suggest a strong, sustainable trend. Conversely, price movements on low RVOL may indicate a weak or unsustainable trend.
3. RVOL as a Liquidity Gauge
Stocks with higher RVOL tend to offer better liquidity, allowing traders to enter and exit positions more efficiently. This is particularly important for intraday traders who need to minimise slippage and execution risk.
4. Identifying Trading Opportunities through RVOL
Traders often use RVOL to spot potential breakouts, reversals, or unusual trading activity. A stock experiencing a sudden surge in RVOL may be poised for significant price movement, presenting actionable opportunities.
Integrating RVOL into Trading Strategies
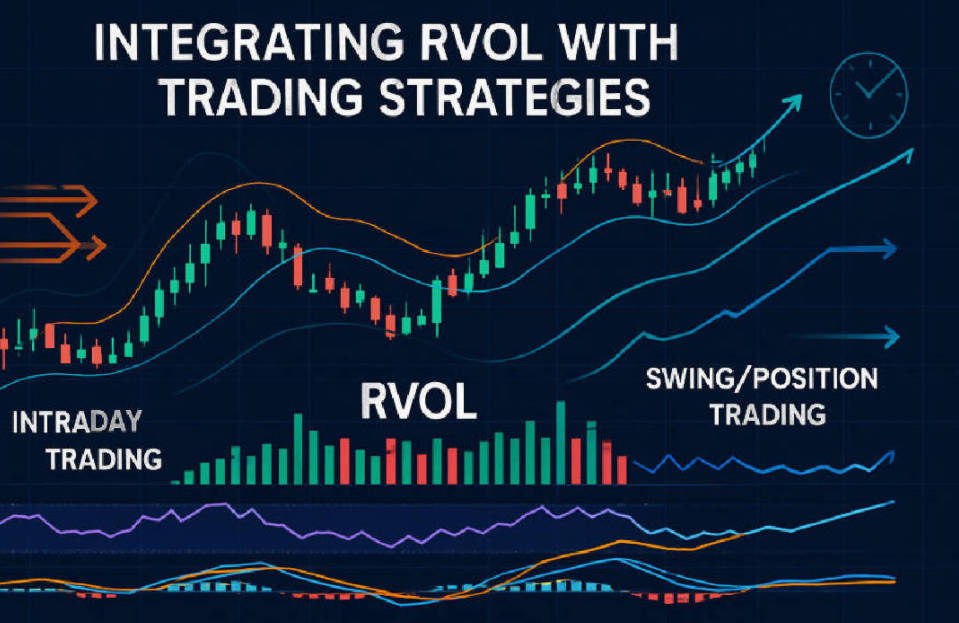
1. RVOL for Intraday and Day Trading Decisions
Day traders monitor RVOL to find "in-play" stocks—those with unusually high trading activity likely to experience price swings throughout the day. RVOL can help identify the best times to enter or exit trades.
2. RVOL for Swing and Position Trading
For swing traders, RVOL can highlight stocks poised for breakout or trend continuation. Monitoring relative volume over multiple days helps confirm that a price move is backed by market interest.
3. Combining RVOL with Technical Indicators
RVOL is most effective when used alongside other indicators such as:
4. Time-of-Day RVOL Analysis
Intraday RVOL patterns often peak at market open and close. Understanding these patterns enables traders to anticipate periods of heightened activity and avoid false signals during quieter periods.
Case Studies: Real-World RVOL Applications
Example 1: A mid-cap stock experiences an RVOL of 3.5 following a positive earnings report, resulting in a 12% intraday price gain.
Example 2: A low-RVOL stock moves slightly upward but fails to break resistance, confirming the price move lacks strength.
Advanced RVOL Strategies and Optimisation
1. RVOL Screening and Alerts for Traders
Traders can use scanning tools on platforms like TradingView, ThinkorSwim, and NinjaTrader to monitor high-RVOL stocks in real-time, saving time and identifying potential opportunities quickly.
2. Customising Lookback Periods
Adjusting the historical period for average volume calculation can tailor RVOL to different stocks. Small-cap stocks may require shorter lookback periods, whereas large-cap stocks may benefit from longer periods to reduce noise.
3. RVOL and News-Driven Trading
News events, mergers, or macroeconomic announcements often drive RVOL spikes. Traders who monitor RVOL in conjunction with news feeds can capitalise on rapid price movements.
4. Risk Management with RVOL
High RVOL can indicate opportunity, but it may also reflect market overreaction. Traders should set stop-loss levels, avoid chasing spikes without context, and combine RVOL signals with other analysis tools.
Common Misconceptions and Mistakes with RVOL
1. Overreliance on RVOL Alone
RVOL is a valuable metric, but using it in isolation may lead to misleading conclusions. Always combine RVOL with price action, technical indicators, and market context.
2. Misinterpreting Low RVOL Periods
Low RVOL does not always indicate a lack of opportunity. It may represent consolidation before a significant move. Understanding context is essential.
3. Ignoring Broader Market Context
RVOL spikes can occur across sectors or the broader market. Comparing individual stock RVOL to sector and index trends prevents misinterpretation.
Tools, Platforms, and Resources for Monitoring RVOL
TradingView: Real-time RVOL charts and alerts.
ThinkorSwim: Customisable scanners for high-volume stocks.
NinjaTrader: Advanced filtering and automated RVOL tracking.
Screeners and Alerts: Automate RVOL monitoring to streamline trading decisions.
Conclusion: Leveraging RVOL for Informed Trading Decisions

Relative Volume (RVOL) is an indispensable metric for traders seeking to understand market activity beyond price alone.
By identifying unusually high or low trading activity, confirming trends, and spotting potential breakouts, RVOL provides actionable insights.
Integrating RVOL with technical indicators, risk management, and market context empowers traders to make informed, strategic decisions in any market environment.
Frequently Asked Questions
1. What RVOL level indicates a breakout?
Typically, RVOL > 2 signals above-average interest and potential for significant price movement.
2. Does RVOL differ between small-cap and large-cap stocks?
Yes. Small-cap stocks often exhibit more volatility and higher relative spikes in RVOL.
3.Can RVOL predict trend reversals?
Not directly, but unusually high RVOL at key support/resistance levels can indicate potential reversals when combined with other indicators.
Disclaimer: This material is for general information purposes only and is not intended as (and should not be considered to be) financial, investment or other advice on which reliance should be placed. No opinion given in the material constitutes a recommendation by EBC or the author that any particular investment, security, transaction or investment strategy is suitable for any specific person.
