Published on: 2025-10-07
Updated on: 2025-10-07
Not always. Resistance levels tend to weaken with each test as supply is gradually absorbed, making breakouts more likely after repeated challenges.
The more often the price touches resistance without breaking, the more traders watch it, but each test also reduces the selling pressure available to defend that level.

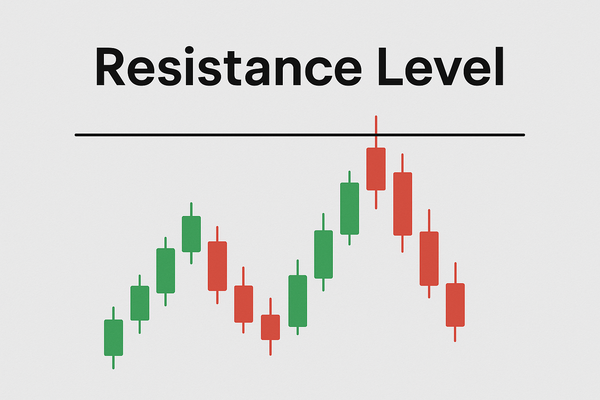
A resistance level is a price point or zone where selling interest emerges, preventing further upward movement.
Resistance levels do not always hold after multiple tests.
Each time the price touches resistance, sellers execute orders and reduce the remaining supply. By the third or fourth test, the level often breaks because persistent buyers have absorbed most of the available selling pressure, making breakouts more probable than continued rejection.
It represents an area where supply historically exceeds demand, but that balance shifts when repeated testing exhausts the sellers waiting at that level.
Resistance levels help traders identify potential reversal points, set profit targets, and plan entries for breakout trades.
They also guide risk management decisions, such as where to place stop losses for short positions and take profit orders for long positions.
Understanding how resistance behaves after multiple tests allows traders to anticipate when a breakout is likely and adjust position sizing accordingly.
Connect at least two clear price rejections at similar levels to establish the zone.
Use price ranges rather than exact lines; resistance typically spans $0.50 to $2, depending on price level.
Prioritise recent touches over old ones; levels from the past three to six months carry more weight.
Look for round psychological numbers like $50, $100, or $500, which attract clustered orders.
Draw fewer levels for clarity; focus on the two to four most obvious zones visible when zoomed out.
Each time the price approaches resistance, sellers who were waiting at that level execute their orders, reducing the remaining supply.
If buyers keep returning and the price does not fall sharply after each rejection, it signals that demand is persistent and supply is being exhausted.
By the third or fourth test, the resistance level may have limited selling pressure left, making a breakout more probable than another rejection.
After a breakout, the old resistance often becomes new support as traders who missed the entry look to buy on pullbacks to that level.
A stock trades in a range between $45 and $50 for several weeks.
The first time the price reaches $50, strong selling pushes it back to $47. The second test a week later also fails, but the price only dips to $48, showing less selling pressure.
On the third test, the price touches $50 and holds for two days, absorbing more supply. A trader buys $5,000 worth at $49.80 with a stop at $48.50, expecting a breakout.
Price breaks $50.00 on volume and rallies to $52.50. The trader takes profit at $52, banking $2.20 per share on 102 shares, or roughly $224 before fees.
Later, when the price pulls back to $50, it holds as support, confirming the role reversal.
After resistance breaks on strong volume, the old level often provides support on subsequent pullbacks, creating a second entry opportunity with defined risk.
Traders who missed the breakout set buy orders at the old resistance, short sellers who exited at the break re-enter longs on pullbacks, and psychological round numbers maintain their magnetic effect even after breaking.
Wait for price to break resistance by at least two to three per cent with volume confirmation, set alerts for pullback to the old resistance level now acting as support, enter long when price tests the level and holds, placing a stop just below the zone. This offers tighter risk than chasing the initial breakout.
| Strong Resistance | Weak Resistance |
|---|---|
| High volume on initial rejections | Low volume on rejections |
| Sharp reversals after touching level | Slow grinding pullbacks |
| Wide price gaps after rejection | Small moves away from level |
| Long time between tests in weeks or months | Rapid repeated tests in days |
| Formed after a steep rally | Formed after slow grind |
| Confluence with moving averages or Fibonacci levels | Standalone level with no confluence |
High volume on rejection: signals strong selling interest and increases probability the level will hold again.
Declining volume on each test: suggests sellers are exhausted and breakout is likely.
Volume spike on breakout: confirms genuine interest and validates the break; low volume breaks often fail.
Compare volume to 20-day average: resistance tests with below-average volume tend to be weak.
Higher lows with each approach: price bounces less each time, showing buyers gaining control.
Price hugging the level: spending hours or days just below resistance without sharp rejection.
Declining rejection size: first test drops $5, second drops $2, third barely pulls back.
Consolidation pattern near resistance: tight range just below signals energy building for break.
Gap or strong momentum candle through resistance on volume.
| Mistake | Impact | Fix |
|---|---|---|
| Assuming resistance always holds | Missed breakout opportunities | Watch for weakening signals such as higher lows and reduced rejection size |
| Shorting at resistance without confirmation | Losses if breakout occurs | Wait for rejection candle or volume spike before entering short |
| Ignoring volume at each test | Misjudging breakout probability | Compare volume on each touch; declining volume suggests supply exhaustion |
| Treating all resistance as equal | Poor timing and false signals | Distinguish major levels from minor levels using timeframe and history |
| Not adjusting after breakout | Chasing late or missing pullback entry | Plan for old resistance to become new support and set alerts there |

Professionals layer multiple timeframes to identify resistance confluences where daily, weekly, and monthly levels align, which tend to be stronger and hold longer.
They use order flow and volume profile data to see where the largest concentrations of sell orders sit, then gauge whether those orders are being filled or refreshed after each test.
Before resistance breaks, they look for breadth signals such as increasing volume on up days and decreasing volume on down days, which suggest accumulation.
After a breakout, they often fade early enthusiasm if volume is light, then buy the pullback to the old resistance level if it holds as support, creating a low-risk entry with a tight stop.
Support Level: a price point where buying interest emerges and prevents further declines, often the inverse of resistance.
Breakout: a price move above resistance or below support, signalling a potential trend shift or continuation.
Volume Profile: a tool showing the amount of trading activity at each price level, helping identify strong resistance or support zones.
Role Reversal: the pattern where old resistance becomes new support after a breakout, and vice versa.
Resistance levels do not always hold after multiple tests because each touch consumes available supply and reduces selling pressure.
Watch for declining rejection sizes, rising lows, and volume clues to anticipate when a breakout is more likely than another reversal.
After a break, the old resistance often provides support, offering a second chance for entry with a clear risk level.