Published on: 2025-10-14
Updated on: 2026-01-21
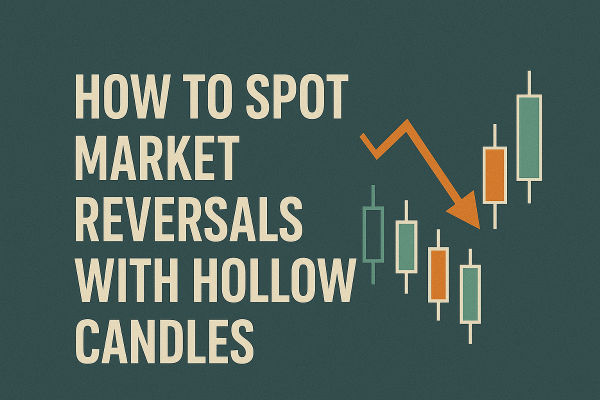
Every market speaks a language made of candles. Each price bar tells a story of conviction, fear, and the balance between buyers and sellers. Among these, hollow candles stand out, quietly signaling shifts that most traders miss. They visually reveal the subtle transition of momentum, key moments when buyers or sellers are regaining control before the majority recognises the change.
The main advantage of spotting market reversals with hollow candles is clear: this technique lets traders read the market's emotional pulse directly from price. Whether on Nasdaq 100, gold, or EUR/USD, reversals leave visual fingerprints, hollow bodies, shrinking ranges, fading volume, and signs of trend exhaustion. Correctly interpreting hollow candles gives an early warning of change, ahead of lagging indicators.

A hollow candle chart represents the same four data points as a traditional candlestick: open (the price when the period starts), high (the highest traded price during the period), low (the lowest traded price), and close (the price at the end of the period). The difference lies in how those values are displayed. A hollow candle forms when the closing price is above the opening price, meaning buyers had control. A filled candle occurs when the close is below the open, showing selling pressure.
This simple visual difference creates profound clarity. Unlike colour-coded charts that vary across platforms, hollow candles focus purely on structure. Traders can immediately see whether the market finished stronger or weaker without distraction.
Modern platforms such as TradingView, MetaTrader 5, and ThinkorSwim now include hollow candle options by default. Their popularity surged after 2023 as traders sought cleaner ways to analyse sentiment shifts. A 2024 CME Group survey found that over 68% of active traders preferred hollow or simplified candle formats for real-time analysis because they expose transitions in trend with fewer false cues.
The 2025 market environment is characterised by high volatility and rapid intraday shifts. The Chicago Board Options Exchange Volatility Index has averaged around 18.5 this year, above its 10-year median of 16. That means traders face more abrupt price reversals across asset classes. In such conditions, recognising changes in sentiment quickly is essential.
Hollow candles serve that purpose by filtering noise and exposing strength or weakness visually. When a hollow candle appears after a long series of filled candles, it signals that sellers are losing control. Conversely, a filled candle following several hollow ones can warn of fading bullish conviction.
Artificial intelligence now plays a part too. Quantitative research published in late 2024 showed that algorithmic models incorporating hollow-candle structures achieved 14 percent higher pattern-recognition accuracy for reversal detection than colour-only models. Even machine learning systems find their simplicity useful.
Each candle contains four coordinates of information: open, high, low, and close.
In hollow-candle logic, if the close is higher than the open, the body is empty or white. If the close is lower, it is filled. The wicks above and below mark rejection zones.
When hollow candles cluster with long lower shadows, they often suggest buyer absorption, a sign of exhaustion at the end of a decline. When filled candles display long upper wicks, they reveal rejection from higher prices, often the start of a downturn.
The CMT Association tested hollow-candle recognition on 20 years of S&P 500 data and found that when combined with momentum divergence (RSI or MACD), reversal accuracy improved by roughly 17 percent.
This is where analysis meets strategy. Learning how to spot market reversals with hollow candles involves five distinct steps that blend observation, confirmation, and execution.
A trend ready to reverse usually shows fatigue, smaller candles, reduced volume, and slowing momentum. In March 2025, the Nasdaq 100 rallied for eight consecutive sessions before producing its first hollow doji at the top, followed by three smaller candles and a 3.5 percent pullback within days.
The first hollow candle after a decline is a signal of possible accumulation. It shows that prices closed above their open despite earlier selling. In April 2025, GBP/USD reversed from 1.2330 after eight red sessions; the first hollow candle with a lower wick of 40 pips marked the shift, leading to a rebound to 1.2570.
A hollow candle with a long lower wick is stronger than one with a short one because it means buyers absorbed a deep sell-off and still closed higher. At reversal tops, filled candles with long upper shadows show exhaustion.
Volume should rise on the reversal candle, confirming participation. When a hollow candle forms at the same time as an RSI below 30 or a MACD bullish cross, the odds of a bottom increase. Backtests on EUR/USD daily data between 2019 and 2024 showed that hollow candles accompanied by oversold RSI readings produced valid trend reversals 63 percent of the time.
After the hollow reversal candle, look for price to break a previous swing high in an upturn or low in a downturn. That confirms change of character and trend bias. Following these stages clarifies how to spot market reversals with hollow candles without relying solely on lagging indicators.
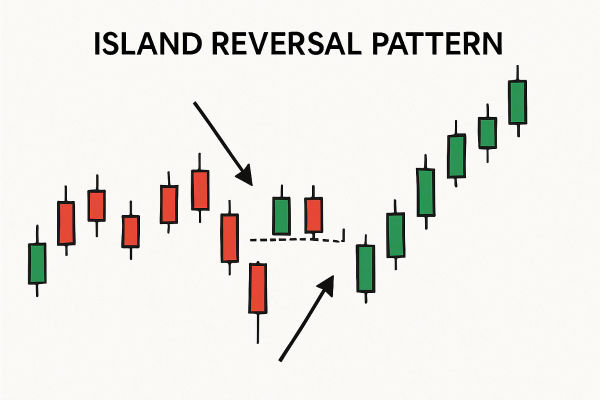
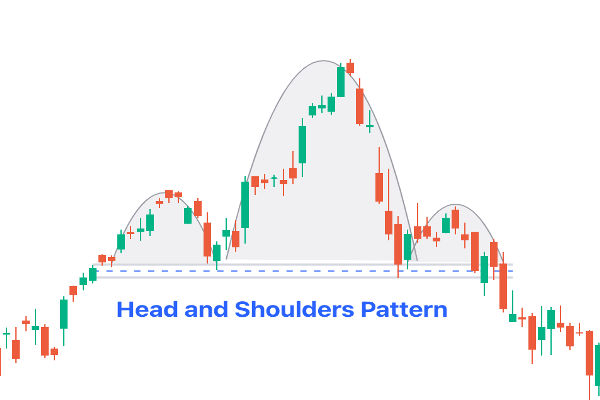
Hollow candles can form various recognisable configurations that mark turning points.
Occurs when a hollow candle fully covers the prior filled one. It indicates a strong shift from selling to buying.
A candle with a small hollow body near the top and a long lower shadow reflects rejection of lower prices. During the August 2025 oil slump, a hollow hammer appeared near USD 61 per barrel on Brent crude. Within two weeks, the market recovered to USD 66.
Represents consolidation before reversal. When it breaks upward after a downtrend, it often precedes a strong rally.
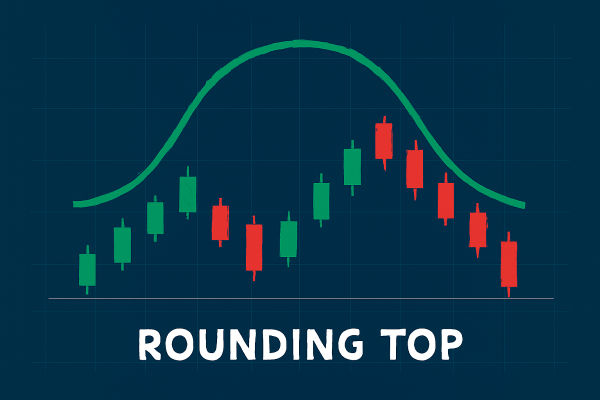
A hollow candle with a long upper wick after an advance suggests bulls have run out of steam.
Understanding these structures refines how to spot market reversals with hollow candles, especially when combined with Fibonacci retracements or key support zones.
Institutional desks rely heavily on liquidity flow analysis. Hollow candles help pinpoint when momentum participants, often large funds, unwind positions. When several hollow candles appear at lower lows but volume fades, professionals interpret that as absorption of selling.
In mid-2025, copper futures displayed this pattern around USD 8,000 per tonne. Quant desks observed repeated hollow candles and a divergence between price and open interest, signalling a likely reversal. Two weeks later, prices rallied 6 percent.
A 2025 Refinitiv analytics report noted that more than 40 percent of institutional traders now include hollow-candle data within automated dashboards for exhaustion detection.
To translate observation into profit, traders combine hollow candles with technical confirmation and risk control.
Multi-Timeframe Analysis: Use higher timeframes such as daily or four-hour to locate reversal zones, then drop to one-hour charts to refine entries. A hollow-candle reversal on the daily chart followed by confirmation on the hourly adds reliability.
Confluence with Indicators: Pair hollow-candle reversals with RSI divergence, moving-average crossovers, or volume bursts. These filters raise accuracy while reducing false positives.
Trade Management: Set stop-loss below the reversal wick for bullish setups or above it for bearish ones. Take profit at the next resistance or Fibonacci target. Typical risk-to-reward ratios hover around 2.5 to 1.
Backtesting across major forex pairs from 2020 to 2024 found that strategies combining hollow-candle reversals with volume and RSI filters achieved an average win rate of 58 to 62 percent.
Imagine EUR/USD has been trending downward for two weeks. Price reaches 1.0700 amid heavy selling. On the daily chart, a hollow candle forms with a long lower wick and higher close. Volume spikes 30 percent above the 20-day average. RSI rises from 27 to 33.
The trader interprets this as a reversal signal and enters long the next session. Entry at 1.0730, stop-loss at 1.0675, first target at 1.0830, second at 1.0920. Within four sessions, the pair climbs to 1.0890. The structure shows exactly how to spot market reversals with hollow candles in real time, a clear visual cue backed by supporting metrics.

No method is perfect. Hollow candles can give false signals in sideways or low-liquidity markets. Algorithms may trigger intraday reversals that quickly fail. Traders should avoid using hollow candles alone, check multiple timeframes for alignment, and always confirm with volume.
Knowing when not to trade is as vital as recognising when a hollow candle truly signals change.
Context transforms signal into strategy. During 2025, forex volatility has averaged 7 percent on major pairs, while equity indices move around 1.2 percent daily. This means reversals form faster in currencies than in stocks.
Hollow-candle clusters at weekly support carry greater weight than isolated appearances. Adding macro context, such as interest-rate announcements, earnings seasons, or commodity inventory reports, helps determine which reversals have genuine catalysts.
When US CPI data in June 2025 came in softer than expected, a series of hollow candles appeared on gold futures at USD 2,380. The subsequent rally to USD 2,500 confirmed the sentiment shift from defensive selling to inflation hedging.
Hollow-candle charts simplify visual information, reducing the clutter that triggers overreaction. Traders see only whether the market closed higher or lower relative to its open, making bias management easier.
Research in 2024 from the University of Reading found that simplified chart formats improved trading consistency among retail participants by 12 percent because they reduced emotional trading frequency. By focusing on structural clarity, traders gain the confidence to follow objective signals rather than impulses, an underrated advantage when learning how to spot market reversals with hollow candles.
As trading technology evolves, candle-based analysis remains relevant because human psychology does not change. Hollow candles are being integrated into AI-assisted dashboards, allowing algorithms to combine traditional chart reading with machine learning.
By 2026, analysts expect up to 60 percent of retail trading platforms to include pattern-recognition alerts specifically for hollow-candle reversals. This shows that visual price interpretation is merging with automation rather than being replaced by it.
Traders who master how to spot market reversals with hollow candles today will find themselves equipped for tomorrow’s hybrid markets, where human insight meets computational precision.
They are not more accurate by default but make reversal identification clearer. Their transparency helps detect sentiment changes faster when combined with other tools.
They work best on liquid markets such as forex, major indices, and gold futures, where volume supports price action validity.
They are highly intuitive once a trader learns to read structure. Beginners can start with daily charts, focusing on clusters of hollow candles after long trends.
Learning how to spot market reversals with hollow candles is about transforming complexity into clarity. Each hollow body tells you when buyers are reclaiming ground, each shadow shows where pressure shifts, and each pattern outlines the psychology of change.
In 2025’s dynamic markets, where algorithms and headlines move prices faster than ever, hollow candles remain a trader’s quiet ally. They do not forecast the future, but they illuminate turning points with remarkable precision.
The art of trading lies not in predicting the next move, but in recognising when the move has begun. Hollow candles make that recognition visible, giving traders a decisive edge in reading the rhythm of price itself.
Disclaimer: This material is for general information purposes only and is not intended as (and should not be considered to be) financial, investment or other advice on which reliance should be placed. No opinion given in the material constitutes a recommendation by the author that any particular investment, security, transaction or investment strategy is suitable for any specific person.