Published on: 2025-09-02
Updated on: 2025-09-02
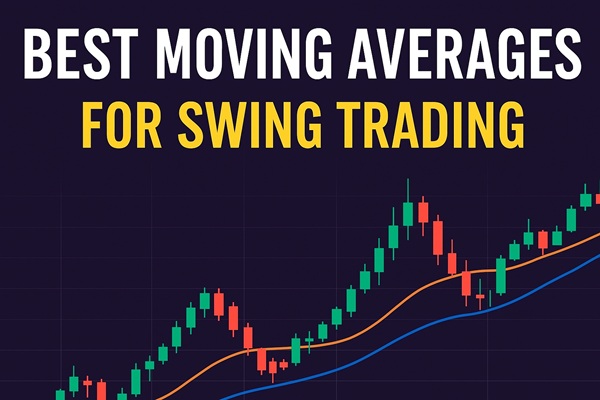
Swing trading, unlike day trading, is designed to capture medium-term price movements that typically last from a few days to several weeks. Traders in this style aim to profit from market "swings" — the oscillations between short-term highs and lows within a broader trend.
To succeed in this approach, traders require tools that filter out market noise while still highlighting turning points with reasonable accuracy. Moving averages (MAs) are among the most trusted of these tools. They smooth out price data, making it easier to see underlying trends and momentum. By applying the right moving averages, swing traders can better time entries, exits, and position adjustments with more confidence.

There are several types of moving averages, each with unique characteristics and applications in swing trading.
Simple Moving Average (SMA)
The SMA calculates the average of a chosen number of closing prices. It is straightforward, widely used, and effective for identifying trend direction. However, its equal weighting of past data means it can react slowly to sudden price changes, sometimes leaving traders late to respond.
Exponential Moving Average (EMA)
The EMA places more emphasis on recent price action, making it more responsive than the SMA. Swing traders often prefer the EMA when they want to react faster to changes in momentum. The downside, however, is that this responsiveness can lead to more false signals in choppy markets.
Weighted Moving Average (WMA)
The WMA applies a linear weighting, giving the most recent data greater influence but in a smoother manner than the EMA. It is less common in everyday swing trading but can be valuable when fine-tuning entry signals.
Advanced Moving Averages (DEMA and TEMA)
Double and Triple Exponential Moving Averages (DEMA and TEMA) are refinements designed to reduce lag further. While less popular than SMA or EMA, they can appeal to experienced swing traders looking to gain a slight edge in timing.
The choice of period — the number of bars or days used in the calculation — is critical. Swing traders most commonly rely on these periods:
20-day or 21-day MA
A short-term benchmark, it reflects roughly one trading month. It's useful for capturing swift market swings and provides dynamic support and resistance.
50-day MA
Widely followed by both retail and institutional traders, the 50-day is seen as the "sweet spot" between responsiveness and reliability. It's ideal for medium-term swing trades.
100-day MA
A longer period that helps filter out short-term noise. It can be especially effective on higher timeframes, offering robust support and resistance zones.
200-day or 250-day MA
The gold standard for long-term market direction. The 200-day MA is closely watched across global markets, while the 250-day MA roughly represents a full trading year. For swing traders, these moving averages help avoid trading against the broader tide.
The Triple Combo (20/50/200 MAs)
Using three moving averages simultaneously provides a layered perspective. The 20-day captures short-term swings, the 50-day identifies medium-term momentum, and the 200-day reveals the overarching trend. This combination is one of the most powerful filters against false trades.
EMA Pairs (8/21 or 20 EMA)
Some traders prefer faster EMAs, such as the 8- and 21-period pair, to catch early signals of trend reversals. These setups are especially popular among more active swing traders who value speed over stability.
Crossovers (Golden and Death Cross)
A golden cross occurs when a shorter MA, such as the 50-day, rises above a longer MA, like the 200-day — a sign of potential bullish momentum. Conversely, the death cross signals bearishness when the short MA falls below the long MA. Swing traders use these as confirmation tools rather than standalone entry triggers.
MAs as Dynamic Support/Resistance
Beyond crossovers, moving averages themselves act as zones where price frequently reacts. Prices often "bounce" off the 50-day or 200-day averages during trending markets, offering natural entry or exit opportunities.

Do Not Use in Isolation
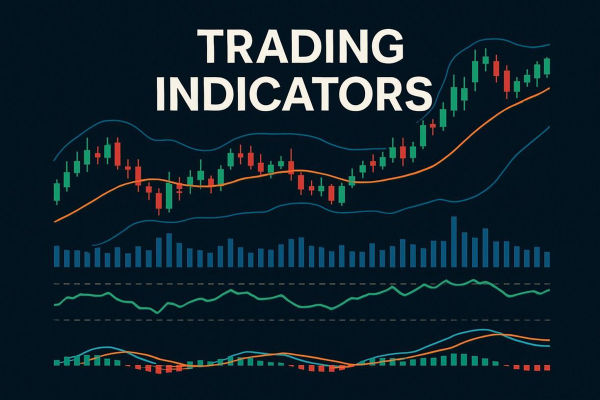
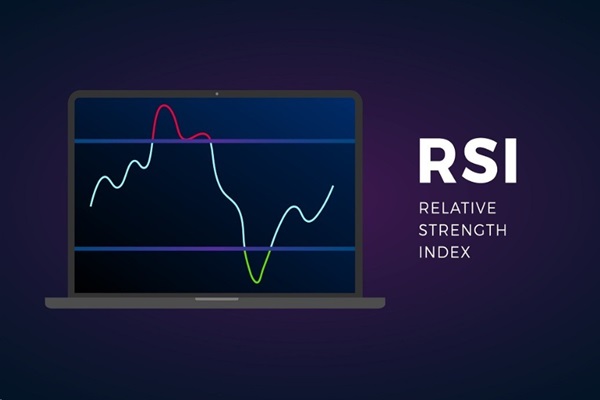
Moving averages are best used alongside other indicators such as the Relative Strength Index (RSI), Moving Average Convergence Divergence (MACD), or volume analysis. Alone, they may mislead in sideways markets.
Align Across Timeframes
A bullish signal on a daily chart is more reliable if confirmed on a four-hour or weekly timeframe. Multi-timeframe analysis reduces the likelihood of entering against the prevailing momentum.
Adjust Periods for Volatility
Markets are not static. In volatile conditions, shorter moving averages (such as the 20-day) may whipsaw traders. Extending to longer averages (like the 50-day or 100-day) can smooth out signals.
Beware of Lag
All moving averages are inherently lagging indicators. They confirm rather than predict. Traders must accept this trade-off between noise reduction and timeliness.
A practical strategy might involve combining a 20-day SMA to identify the short-term trend with a 12-day EMA to pinpoint entries. For instance, if the 20-day SMA shows a rising trend and the 12-day EMA crosses above it, a trader might consider entering a long position.
Equally important is backtesting. Every trader's risk tolerance, timeframe, and market preference differ. Testing combinations of MAs on historical data ensures that the chosen approach aligns with one's personal trading style.
Q1: Which moving averages are best for swing trading?
The most commonly used are the 20/21-day, 50-day, and 200-day MAs. The 20 captures short swings, the 50 balances medium-term trends, and the 200 confirms overall direction.
Q2: SMA vs EMA — which should I choose?
The SMA offers smoother signals and is less sensitive to short-term fluctuations. The EMA reacts faster to new price data, making it more suitable for traders who prefer quicker signals.
Q3: What periods should I use for entries versus trend detection?
Shorter EMAs (such as 8–21) are better for identifying entry points, while longer SMAs (50–200) are best for assessing the overall trend.
Q4: Can moving averages act as support or resistance?
Yes. Prices often respect moving averages as dynamic support or resistance, particularly the 50- and 200-day MAs, which are closely watched by market participants.
Q5: What are golden and death crosses?
These occur when shorter MAs cross longer MAs. A golden cross (bullish) happens when a shorter MA rises above a longer MA, while a death cross (bearish) happens when it falls below.
Q6: How can I avoid false signals?
Combine moving averages with other indicators, confirm signals across multiple timeframes, and adapt your chosen MA lengths to current market conditions.
There is no single "best" moving average for swing trading; the right choice depends on market conditions, timeframe, and personal preference. The 20-, 50-, and 200-day moving averages remain the most reliable standards, offering clarity across different horizons. Used in combination — and alongside other indicators — moving averages can become a cornerstone of a robust swing trading strategy.
Disclaimer: This material is for general information purposes only and is not intended as (and should not be considered to be) financial, investment or other advice on which reliance should be placed. No opinion given in the material constitutes a recommendation by EBC or the author that any particular investment, security, transaction or investment strategy is suitable for any specific person.