Published on: 2026-09-14
USD/INR settled at 95.5981 on Friday, 11 September, after wicking to 95.8178 and handing the level straight back. The pair has gained 1.69% off its 2 September low at 94.2244, rebuilding a short-term uptrend on an eight-session sequence of rising lows.
The chart question is quite narrow. The 95.80 area has repeatedly capped advances since mid-August, and Friday produced another failure there. Whether the pair turns that ceiling into a floor decides the next leg.
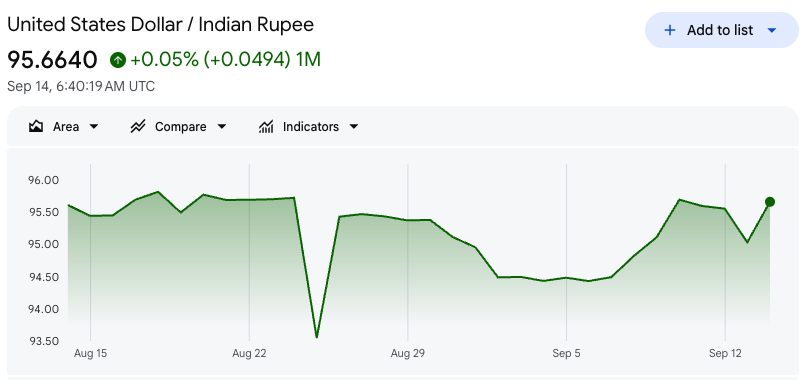
Eight sessions have passed since the September low and not one has undercut the low before it. The sequence climbs from 94.2244 through the mid-94s to 95.4839 on Friday, and it got there without a single wide reversal candle. Grinding advances of that shape usually reflect steady importer and hedging demand rather than a positioning squeeze.
The closing picture is less tidy. Thursday settled at 95.6907, above Friday’s 95.5981, so the pair has not strung consecutive higher closes together, which leaves structure resting on defended lows rather than on buyers carrying the pair into the settle.
Friday itself was a rejection rather than a break in trend. The pair opened at 95.6908, printed its high, then closed beneath the open, leaving an upper wick into supply. The session low still held above Thursday’s, which is what keeps the sequence alive.
| Indicator | Friday Close Reading | Signal |
|---|---|---|
| Spot | 95.5981 | Last settled close |
| 5-day SMA | 95.1720 | Price 0.43 above |
| 10-day SMA | 94.9472 | Price 0.65 above |
| 20-day SMA | 95.2655 | Price 0.33 above |
| RSI-14 | Near 53 | Barely above neutral |
| 14-day ATR | 0.4612 | Expected daily range |
| Rising lows | 8 sessions | Structure intact |
Eight sessions since 18 August have traded into 95.78 or higher, and six of those printed 95.80 itself. None closed above the zone. On two occasions in late August the pair reached the 95.90s and finished more than 15 paise lower, which is the signature of offers arriving on strength rather than of buyers losing conviction.
The RBI sold dollars on 9 September as the pair cleared 95, and its stated position is that it smooths volatility rather than defends any particular level. That does not make 95.80 an official line, though it does mean topside attempts have been meeting a supplier with deep reserves and no need to chase.
What separates a touch from a break is where the session ends. Repeated intraday prints into the zone have changed nothing, whereas a daily close above 95.90, confirmed by a second, converts resistance into a base and brings 96.00 into play.
| Technical Role | Level | Interpretation |
|---|---|---|
| Immediate resistance | 95.75-95.82 | Breakout zone, repeatedly tested |
| Breakout resistance | 96.00 | Psychological threshold |
| Major resistance | 96.60-97.11 | Upper stress zone |
| First support | 95.44-95.48 | 23.6% retracement |
| Key support | 95.10-95.21 | 38.2% retracement |
| Secondary support | 94.80-94.83 | 61.8% retracement |
| Major support | 94.43-94.57 | Early-September base |
| Invalidation area | 94.22-94.30 | September swing low |
Retracements of the 94.2244 to 95.8178 swing fall at 95.44, 95.21 and 94.83, and each of the last three session lows has landed within a few paise of one of them, so price action and ratio are pointing at the same shelves.
95.10 to 95.21 carries the most weight, holding the 38.2% retracement and Thursday’s low together on ground the pair cleared on the way up. Beneath it, 94.80 is where a pullback becomes a retracement, with the early-September base below that.
Price trades above all three averages, though the order beneath it undercuts the signal. A confirmed uptrend shows the 5-day over the 10-day over the 20-day, whereas here the 20-day is the highest of the three, because August’s richer range has yet to roll out of the window.
RSI-14 near 53 reads the same way. Eight sessions and 1.69% of gains would usually push momentum into the mid-60s, so the pair has climbed without generating thrust, which fits a market lifted by steady demand and capped by a patient seller.
The averages will only stack properly if the pair holds above roughly 95.30 for another week, leaving both readings as lagging confirmation of a breakout rather than a reason to front-run one.
Crude does most of the work in this pair. India imports the large majority of its oil, so with Brent above $107, the import bill widens and refiners buy dollars to cover it. The pair broke 95 on 9 September; in the same session Brent cleared $100.
Closer at hand is the Fed decision on 16 September. CME FedWatch put the odds of a quarter-point increase near 90% after Friday’s CPI report, up from roughly 70% the day before, once core prices rose 0.3% against a 0.2% consensus. A hike would move the target range to 3.75% to 4.00%, further narrowing India’s policy-rate advantage and strengthening the yield support behind the dollar.
Pulling the other way, the RBI has held the repo rate at 5.25% since a unanimous June decision, with FY27 inflation projected at 5.1% on higher energy costs. Governor Sanjay Malhotra has been explicit that the bank targets no exchange-rate level and acts only against disorderly moves, which is why the ceiling holds without producing a reversal.
Bullish. Hold 95.44 and close decisively above 95.90, opening 96.00 and then the 96.60 to 97.11 zone. Confirmation is a second close above 95.90 and a pullback that finds bids at 95.75. Invalidated below 95.44.
Range. The base case while structure resolves, is roughly 95.10 to 95.82. With the 14-day ATR at 0.46, that band is two sessions wide. Active RBI participation makes several false breaks likely before direction settles.
Bearish. A close below 95.10 takes out the 38.2% retracement and Thursday’s low together, exposing 94.83 and then the early-September base. The rising-low sequence ends only on a close below 94.80, and a move under 94.22 overturns the September rebound.
The near-term bias is mildly bullish. Structure, price position and an unbroken run of rising lows favour the topside, but repeated failures at one level, on momentum this flat, point to persistent supply rather than a coiling spring.
A close above 95.90 confirms continuation. A close below 95.10 weakens the thesis materially. A close below 94.80 ends the sequence outright. Until then, USD/INR is a recovery leaning on an intervention-sensitive ceiling rather than a breakout.