Published on: 2025-04-24
Updated on: 2025-04-24
The ABCD pattern is one of the most commonly used Chart Patterns in technical analysis. It is particularly valued for its simplicity and versatility in identifying trends. The ABCD pattern helps traders predict potential price movements by recognising a clear sequence of price action, which can then be used to make informed trading decisions.
However, like any trading tool, it is easy to make mistakes when using the ABCD pattern, especially if you're not fully familiar with its nuances. In this article, we will explore the top five mistakes traders often make when using the ABCD pattern, and how to avoid them for a more successful trading experience.

1. Ignoring Market Context and Trend Direction
One of the most common mistakes traders make when using the ABCD pattern is ignoring the overall market context and trend direction. While the pattern is useful for identifying potential reversals or continuations, it works best when used in conjunction with the broader trend.
For example, trying to trade an ABCD pattern during a strong uptrend or downtrend without considering the prevailing market sentiment can lead to disastrous outcomes. If the market is trending sharply in one direction, an ABCD pattern may indicate a temporary pullback rather than a genuine reversal. Traders should always assess the larger context—whether the market is bullish, bearish, or neutral—before relying on the ABCD pattern.
Tip: Always align the ABCD pattern with the broader market trend to increase the likelihood of a successful trade.
2. Overlooking the Validity of Points A, B, C, and D
Another mistake traders make is overlooking the importance of validating each point of the ABCD pattern. Each of the points—A, B, C, and D—represents a critical price level that determines the strength and reliability of the pattern.
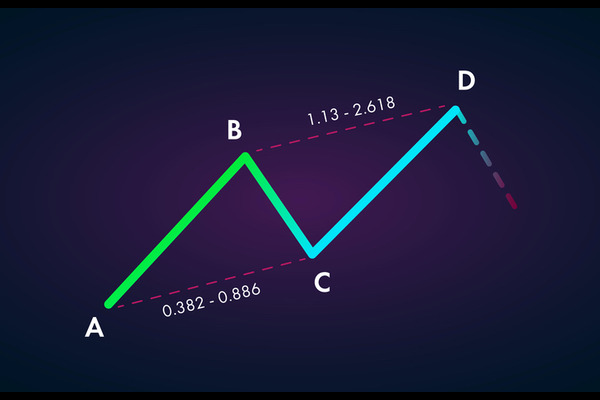
Point A is the starting point.
Point B is the initial move in the opposite direction.
Point C is the retracement of the initial move.
Point D is the final extension or reversal point.
Each of these points needs to be clearly defined and validated. If the points are not precise, the pattern loses its accuracy. For instance, if point C does not retrace by a certain percentage of the AB leg, or if point D does not align with the typical extension range of the pattern, then the pattern may not hold.
Tip: Pay close attention to the measurements of each point and ensure the pattern is symmetrical and within expected ranges.
3. Failing to Use Proper Stop-Losses
While the ABCD pattern is a popular tool among traders, it is not without risk. A significant mistake made by many traders is failing to use proper stop-loss orders when trading the ABCD pattern. Even when the pattern appears well-formed and seems to predict a reversal, the market can sometimes move against the trader.
Without a proper stop-loss, traders may be exposed to larger-than-expected losses if the price action deviates from the expected outcome. Stop-loss orders should be placed at strategic levels, such as just beyond the point of D or below point A, to minimise risk while trading the pattern.
Tip: Always use stop-losses to manage risk and protect yourself from significant losses, even if the ABCD pattern appears to be a clear setup.
4. Misinterpreting the C Point
The C point in the ABCD pattern is particularly critical, as it represents the retracement of the initial move from point A to point B. However, many traders misinterpret the C point, especially if the retracement does not meet typical expectations.
The C point often forms at a Fibonacci retracement level, such as the 61.8% or 78.6% levels, but this is not always the case. The mistake occurs when traders assume that the pattern is invalid if the C point doesn't align with these levels. The ABCD pattern is flexible, and while Fibonacci retracements are helpful, they should not be the sole determining factor. It's important to consider other technical indicators and price action to confirm the C point.
Tip: Treat the C point as a general area of retracement rather than a fixed level. Use additional indicators to validate the pattern's validity.
5. Overtrading the ABCD Pattern
One common mistake that can occur with the ABCD pattern is overtrading. Traders may become overly eager to trade any ABCD pattern they spot, even when the conditions are not ideal. This is particularly true for novice traders who are still learning how to spot reliable setups.
Overtrading can lead to a series of small losses that accumulate into a significant drawdown in a trader's account. To avoid this, traders must practice patience and discipline. Only trade ABCD patterns when the market conditions are right, and the setup has been validated by other indicators or price action analysis.
Tip: Focus on high-quality ABCD setups rather than trying to trade every pattern you see. Wait for confirmation from other technical indicators or chart patterns.
The ABCD pattern can be a powerful tool for identifying potential price movements and making informed trading decisions. However, like any trading strategy, it comes with its risks and requires careful attention to detail. By avoiding the five common mistakes outlined above, you can improve your chances of success when trading with the ABCD pattern.
Remember to always consider the broader market trend, validate each point in the pattern, use stop-loss orders, and avoid overtrading. By doing so, you can make the most of the ABCD pattern and enhance your trading strategy.
Disclaimer: This material is for general information purposes only and is not intended as (and should not be considered to be) financial, investment or other advice on which reliance should be placed. No opinion given in the material constitutes a recommendation by EBC or the author that any particular investment, security, transaction or investment strategy is suitable for any specific person.