Published on: 2025-05-29
Updated on: 2025-05-29
In trading and investing, few terms generate as much excitement—and sometimes anxiety—as ATH or All-Time High. Whether you're watching coins break records, stocks like Apple or Tesla hit new peaks or commodities surge in value, ATHs often signal strong market sentiment, media buzz, and speculative activity.
But what does ATH mean? Is it a good time to buy, sell, or hold when an asset reaches an all-time high?
This guide explains the meaning of ATH, its impact on trading decisions, the psychology involved, and how to develop effective strategies for it.

ATH stands for All-Time High. It refers to the highest price level an asset has ever reached in its trading history.
This could apply to:
Cryptocurrencies
Commodities
Indices
Forex pairs
An ATH can occur in any time frame and is often a sign of bullish momentum.
ATH in Different Markets
1) Forex Market
ATHs are less commonly referred to in forex due to their relative valuation. Instead, traders focus on multi-year highs or historic exchange rate levels.
2) Commodities Market
ATHs in commodities often relate to macro trends, such as inflation, war, or supply shortages.
Examples of ATHs in Markets
Stocks:
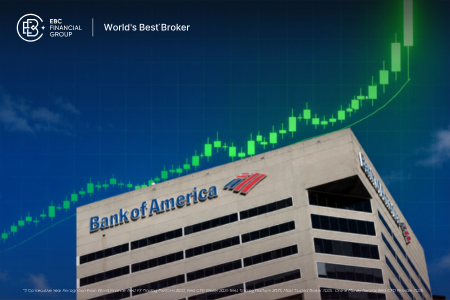
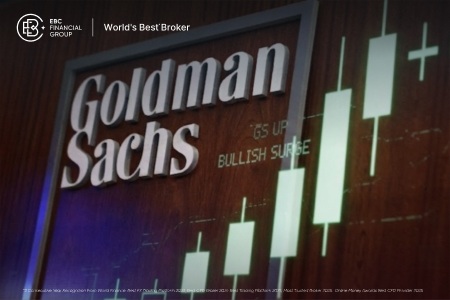
Apple (AAPL) reached new all-time highs multiple times because of strong iPhone sales and share buybacks.
NVIDIA (NVDA) hit ATHs driven by AI and chip demand.
Commodities:
Gold reached its all-time high during global crises and inflation fears.
Oil reached ATHs during supply shocks.
Indices:
The S&P 500 and NASDAQ often reach new all-time highs during bull markets and periods of economic expansion.

1. Strong Earnings or Fundamentals
Positive quarterly reports or growing revenues can drive Stock Prices higher.
2. Market Sentiment
Widespread optimism, especially among retail traders, can push prices to new highs.
3. Macro-Economic Factors
Low interest rates, government stimulus, or inflation hedging can cause investors to seek growth or safe-haven assets.
4. Technical Breakouts
When a price breaks above a historical resistance zone, such as the previous ATH), it often triggers buy orders and short-covering.
5. FOMO (fear of missing out)
Many traders enter a rally late, causing prices to rise even further.
The Psychology Behind ATHs
Human behaviour plays a significant role in how ATHs are perceived.
Psychological Factors:
Confidence bias: Belief that prices will continue rising
Anchoring: Traders see the ATH as a benchmark and wait for pullbacks
Herd Mentality: Traders follow others into the market during strong trends
Greed: Expecting continuous upside, many ignore signs of overvaluation
The bullish sentiment at ATHs often leads to
Increased volume
Speculative bets
However, excessive euphoria can also signal an upcoming market correction.

ATHs can be used in several different ways depending on the trader's style:
Traders look for a strong volume surge and price close above the previous ATH, expecting continued upside.
Buy signal: Price closes above ATH with a strong volume
Stop-loss: Just below the previous ATH
Target: Measure the height of the previous consolidation
2. Retest Strategy
After breaking the ATH, the price may pull back to test it as a new support level. If it holds, that's a good entry point.
3. Contrarian or Mean Reversion
Some traders bet against new all-time highs, expecting a pullback due to overbought conditions.
Sell signal: Price shows signs of reversal after making an ATH
Indicators used: RSI, MACD divergence, candlestick patterns
4. Trailing Stop Strategy
Investors already holding the asset at a profit may use trailing stops to lock in gains while allowing for more upside.
Common Indicators Used Around ATHs
| Indicator | Purpose |
|---|---|
| Volume | Confirms breakout strength |
| RSI (Relative Strength Index) | Identifies overbought/oversold levels |
| MACD | Measures momentum shifts |
| Fibonacci Retracement | Predicts pullback zones after an ATH |
| Moving Averages | Confirms trend direction and support levels |
| Investor Type | View on ATHs | Action |
|---|---|---|
| Long-term investor | May use ATHs as proof of strong fundamentals | Hold or rebalance |
| Short-term trader | Sees ATHs as opportunity for momentum plays | Enter on breakout or fade rally |
| Swing trader | Looks for pullback after ATH | Enter on support retest |
| Day trader | Capitalizes on short-term price action | Uses tight risk-reward setups |
Importance of All-Time Highs
All-Time Highs matter because they:
Reflect strong demand for an asset
Often coincide with breakout patterns
Lead to momentum buying
Attract media attention and new investors
Serve as psychological resistance or support levels
In conclusion, all-time highs are powerful milestones in trading that can indicate market strength, investor enthusiasm, and potential trading opportunities. But while they attract attention and can lead to significant profits, ATHs also come with increased risk.
By applying tools like volume analysis, RSI, stop-losses, and avoiding emotional trading, you can harness the power of ATHs to make smarter, more profitable decisions.
Disclaimer: This material is for general information purposes only and is not intended as (and should not be considered to be) financial, investment or other advice on which reliance should be placed. No opinion given in the material constitutes a recommendation by EBC or the author that any particular investment, security, transaction or investment strategy is suitable for any specific person.