Published on: 2025-05-22
Updated on: 2026-08-17
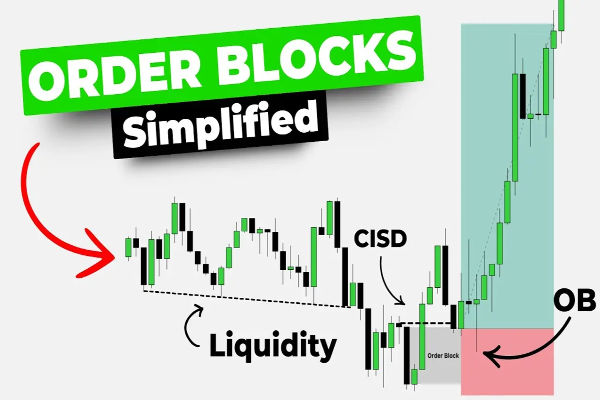
An order block is the last candle that closes against the trend before price makes a strong, sudden move in the opposite direction. Traders treat that candle's range as a zone where large institutions placed heavy buy or sell orders. Because institutions rarely fill a full position in one transaction, price often returns to the zone later, and traders watch that return for a reaction.
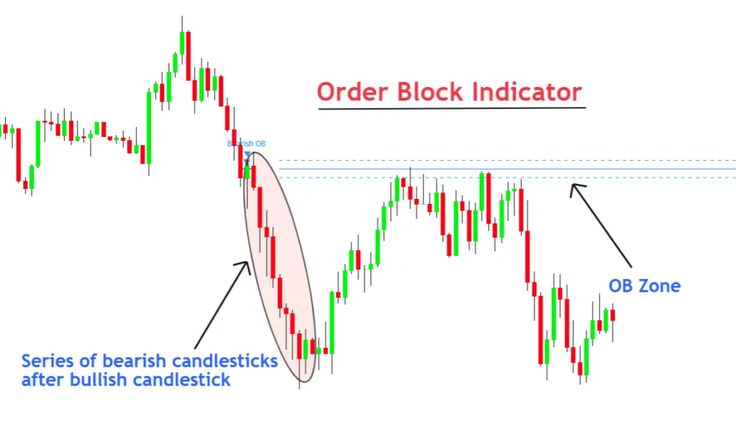
An order block is the last candle closing against the trend before a strong impulsive move the other way.
Bullish blocks are down-closing candles before a rally. Bearish blocks are up-closing candles before a decline.
A valid block requires displacement, a break of structure, and usually a fair value gap; a prior liquidity sweep adds weight.
The first return to a block, called mitigation, carries the highest probability. Repeated tests weaken the zone.
An order block is a single candle, or small cluster, marking the origin of an impulsive move. In the smart money concepts approach, that candle shows where banks, funds, and other large participants built a position.
The logic rests on order size. The Bank for International Settlements measured global foreign exchange turnover at $9.6 trillion per day in April 2025, with about half involving funds and other institutional counterparties. Orders of that scale cannot be filled at one price, so institutions split them, leaving unfilled orders near the origin of the move. When price returns there, the remaining orders can absorb the pullback and push price away again.
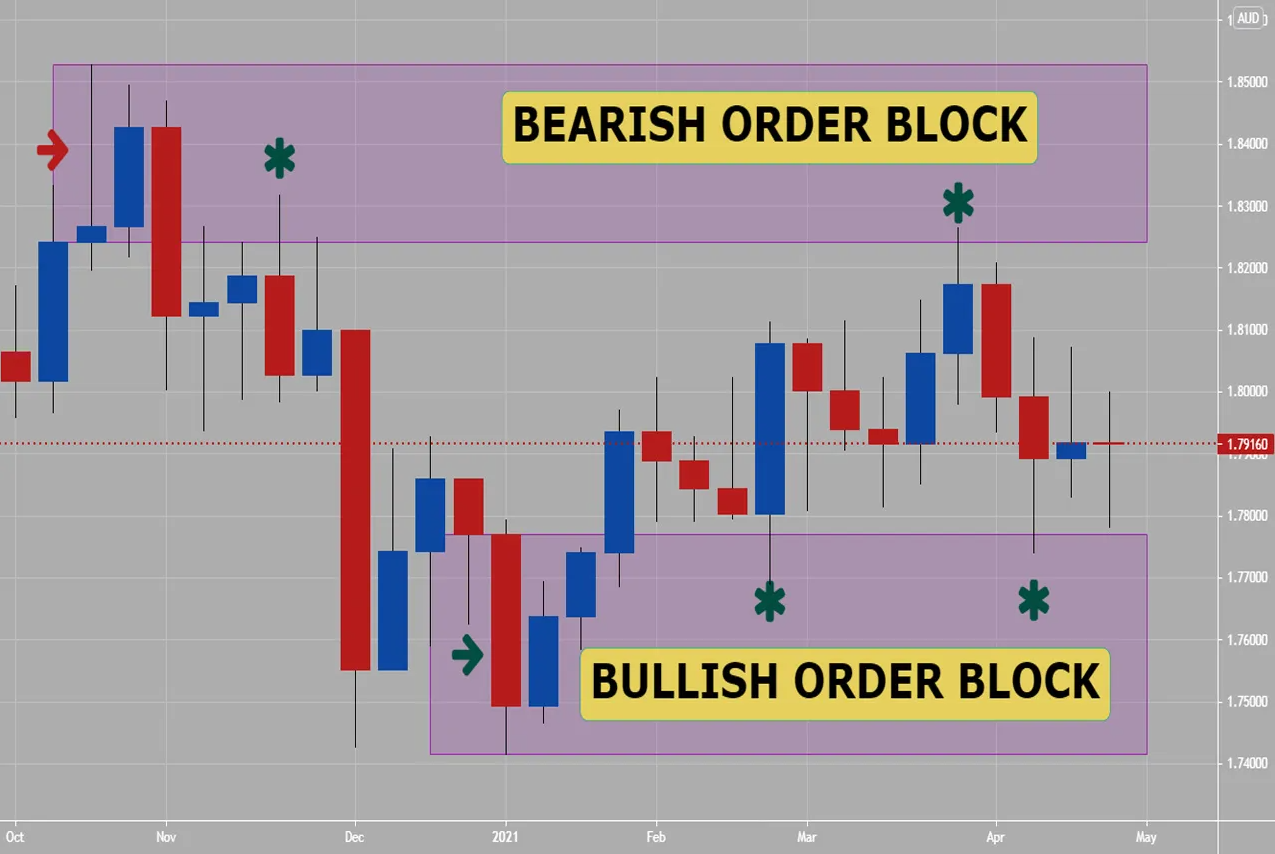
A bullish order block is the last candle that closes lower before a strong move up. The market looks weak for one final moment, then reverses with force. Traders treat its range as a demand zone.
A bearish order block is the mirror image: the last candle that closes higher before a strong move down. Its range becomes a supply zone.
Type |
Final candle |
Move that follows |
Role on return |
Bullish order block |
Closes down |
Strong rally |
Possible support |
Bearish order block |
Closes up |
Strong decline |
Possible resistance |
Most candles that close against the trend mean nothing. A block earns attention only when the move away from it passes five checks.
Displacement. The move away is fast and one-sided, with large bodies and small wicks. A slow drift does not qualify.
A break of structure. The move breaks a previous swing high or low. A confirmed break of structure shows the push had real force, not just movement inside a range.
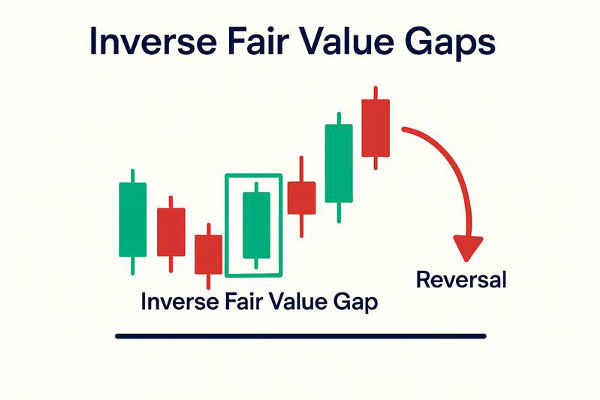
An imbalance. Displacement usually leaves a fair value gap, a three-candle pattern where the first and third candles do not overlap. A gap next to the block shows one side overwhelmed the other.
A liquidity sweep before the block. The strongest blocks appear right after price runs through an obvious high or low and triggers resting stops. That liquidity sweep supplies the volume large players need before the reversal.
Freshness. Price has not returned to the zone yet. Each test consumes the remaining orders, so a block touched several times loses its edge.
A candle that fails these checks is background noise, no matter what it looks like on the chart.
Marking the full candle range works, but three refinements tighten it.
Body over wick: Many traders draw the zone from open to close rather than high to low, because the body shows where most business was done. Neither convention is official.
The 50% level: The midpoint of the block, sometimes called the mean threshold, gives a tighter entry level. Price frequently trades into the deeper half of a block before reacting.
Premium and discount: Measure the dealing range from the last major low to the last major high. Bullish blocks carry more weight in the lower half of that range, the discount. Bearish blocks matter more in the upper half, the premium.
The return is called mitigation. Institutions use it to fill remaining orders or exit positions caught on the wrong side.
If the zone holds, price reacts and continues in the direction of the original displacement. Most order block strategies look for entries on this retest, often after lower-timeframe confirmation such as a change of character.
If price closes cleanly through the zone, the block is invalid. A violated block that retests from the other side becomes a breaker block, and its role flips from support to resistance, or vice versa.
Concept |
How it forms |
How traders read it |
Order block |
Last opposing candle before displacement |
Zone of institutional entries |
Fair value gap |
Three-candle gap inside the displacement |
Inefficiency price may refill |
Supply and demand zone |
Consolidation base before a breakout |
Broad area of unfilled orders |
Breaker block |
Failed order block retested from the other side |
Zone with reversed polarity |
Order blocks and supply and demand zones share the same logic. The difference is precision: a demand zone covers several candles, while an order block isolates one and adds structural conditions.
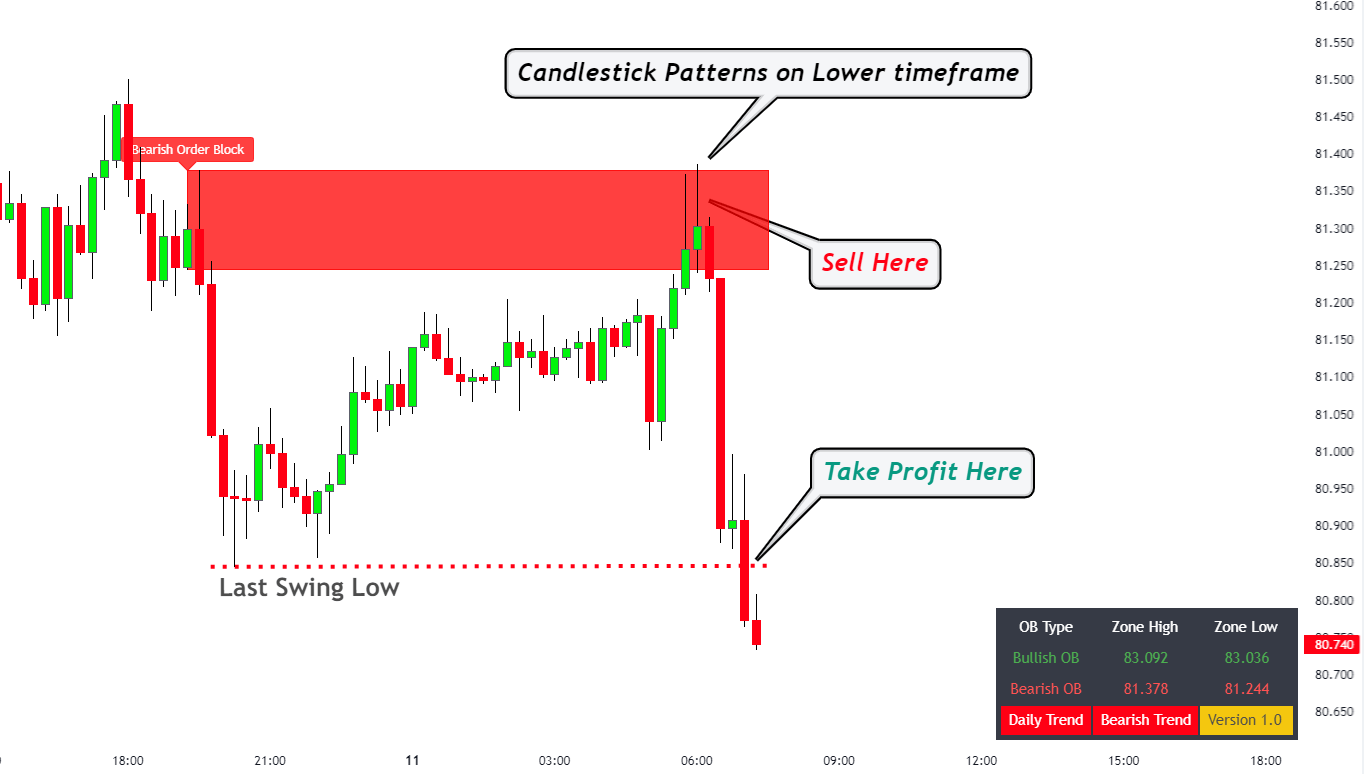
A common educational template: mark blocks on the 4-hour or daily chart, where zones reflect larger order flow. Wait for price to return to a fresh, valid block, then drop to a lower timeframe, such as the 15-minute chart on EUR/USD or gold, for the reaction.
The protective stop sits beyond the far side of the block, since a clean close through it ends the idea. Targets sit at the next pool of liquidity, such as a recent high or low.
Beginners lose money on this concept in predictable ways: marking every opposing candle as a block, trading stale zones, fighting the higher-timeframe trend, and entering without confirmation. Risk control decides more than zone selection. Many traders test the rules on a demo account first; EBC’s trading accounts page lists demo and live options.
Order blocks were developed inside the retail trading community. The vocabulary is widely credited to the Inner Circle Trader methodology, which spread online during the 2010s. No bank or regulator documents order placement this way, and no peer-reviewed research validates the rules. Even drawing conventions vary between educators.
The concept still describes a real market feature: areas where large past orders concentrated. Because the rules are interpretive, strict validation and consistent risk limits matter more than the zone label.
One candle closes against the trend, followed immediately by several large candles in the opposite direction. The reversal candles are large-bodied and break a nearby swing point.
Blocks on the 4-hour, daily, and weekly charts tend to produce cleaner reactions because they reflect larger order flow. Many traders mark zones there and use 5-minute to 1-hour charts only to time the entry.
Price closes through the zone instead of reacting. The failed block often becomes a breaker block, so traders watch the same range for a reaction in the opposite direction.
No method guarantees profit. Results depend on selecting valid blocks, controlling position size, and accepting invalidation quickly. Regulator data shows most retail CFD accounts lose money, so risk management decides outcomes more than any single concept.
Most beginners learn the definition in five minutes, then mark dozens of blocks on every chart. The skill is in the filtering. Displacement, a broken swing, an imbalance, a prior sweep, and an untouched zone: when all five line up, the block deserves attention. When one is missing, the candle is ordinary. Rejecting weak zones on historical charts builds that habit and makes live decisions slower and simpler, which in trading is usually the point.
Disclaimer: This material is for general information purposes only and is not intended as (and should not be considered to be) financial, investment or other advice on which reliance should be placed. No opinion given in the material constitutes a recommendation by EBC or the author that any particular investment, security, transaction or investment strategy is suitable for any specific person.