Published on: 2026-08-26
Updated on: 2026-08-26
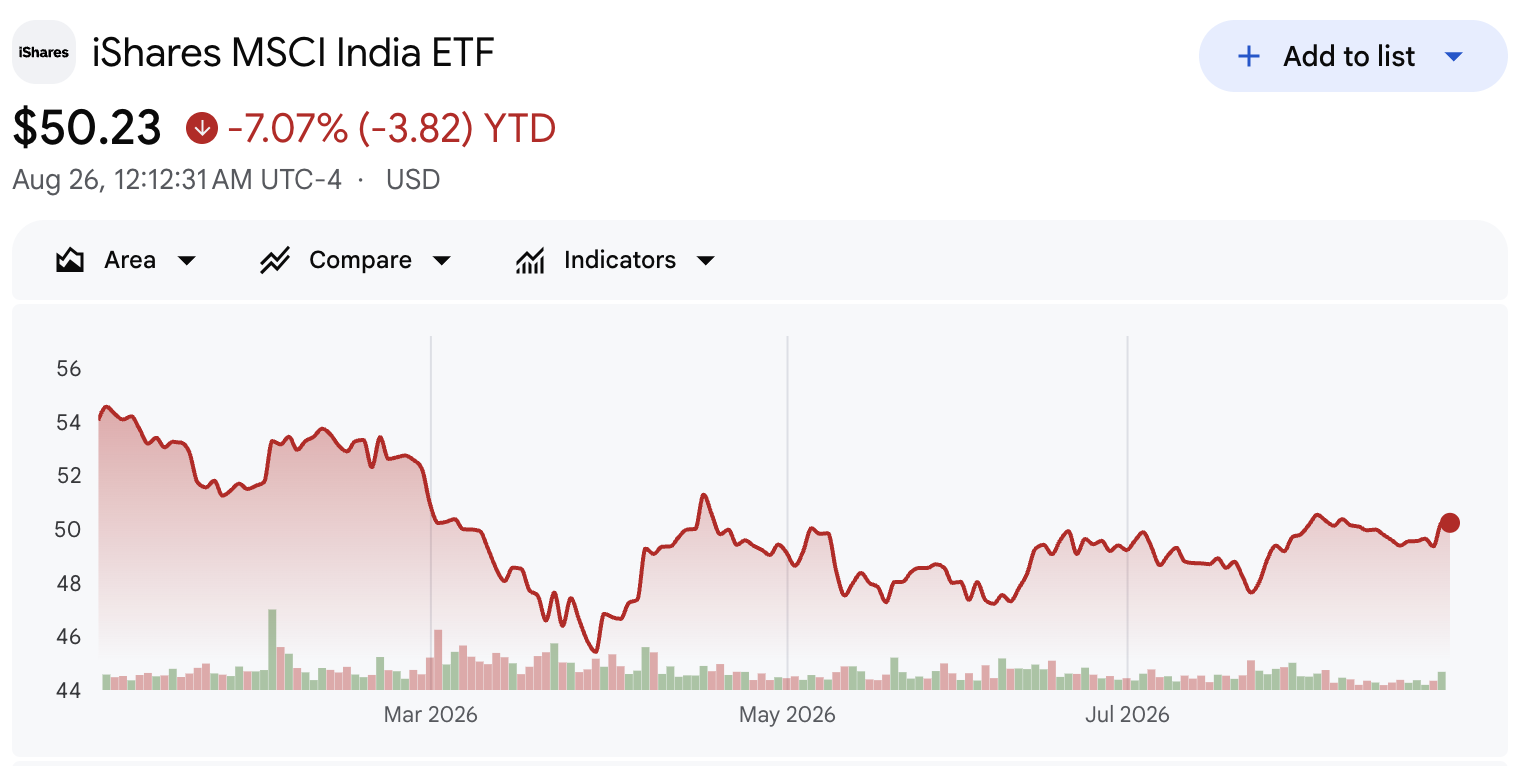
India’s economy expanded 7.7% in FY2025-26, the fiscal year that closed in March. Set against that backdrop, the iShares MSCI India ETF (INDA) is down 8.6% so far in 2026. Both figures are accurate, and the contradiction resolves more neatly than it first appears.

INDA tracks 165 listed companies rather than national output, and it reports in dollars. With the rupee easing from 89.89 to around 95.5, currency translation, valuation and foreign selling have each worked against the economic headline.
That opens a more interesting question. Does INDA actually own the parts of India that are booming?
GDP is not an index. India’s growth spans the whole economy. INDA holds 165 listed large and mid-cap companies.
Currency explains much of the loss. A weaker rupee hurts dollar returns before local equity performance is even considered.
The fund leans on lenders. Financials are the largest bloc by some distance, while India’s newest manufacturing is thinly held.
Foreign money left, then returned. Heavy first-half outflows pressed on share prices and the rupee together.
GDP counts everything: farm output, government spending, the informal economy and several million businesses that will never issue a share certificate. INDA counts 165, weighted by free-float market value.
| Indicator | Latest | Why it counts |
|---|---|---|
| Real GDP growth, FY2025-26 | 7.7% | Economy expanding quickly |
| RBI repo rate | 5.25% | Financing and valuation backdrop |
| USD/INR | ~95.5 | Translation drag on dollar returns |
| INDA, year to date | -8.6% | The investor’s actual outcome |
| INDA financials weight | 30.2% | Concentrated sector exposure |
| SMIN, year to date | +2.0% | India is not a single trade |
The distance between those two definitions is where the year’s disappointment lives. FY26 growth was carried by manufacturing, where gross value added rose 10.7%, and by investment, with gross fixed capital formation up 8.2%.
Behind those figures stand electronics assembly lines, defence order books, semiconductor plants, rail contracts and the capability centres housing foreign research budgets.
The fund’s register reads differently. Financials alone take 30.2%, more than double the next sector, with consumer discretionary at 12.7% and industrials at 10.9% behind them. Information technology, the segment closest to India’s services boom, accounts for 7.1%.
A country ETF can underperform a booming economy whenever the companies driving that boom are underrepresented in the index. What follows sizes each part of that gap: the currency, the valuation, the flows and the weights.
The rupee ended 2025 at 89.89 to the dollar. By late August 2026 it sits near 95.5, having touched the high 96s in July. In dollar terms the currency has surrendered close to 6% of its value in under eight months.
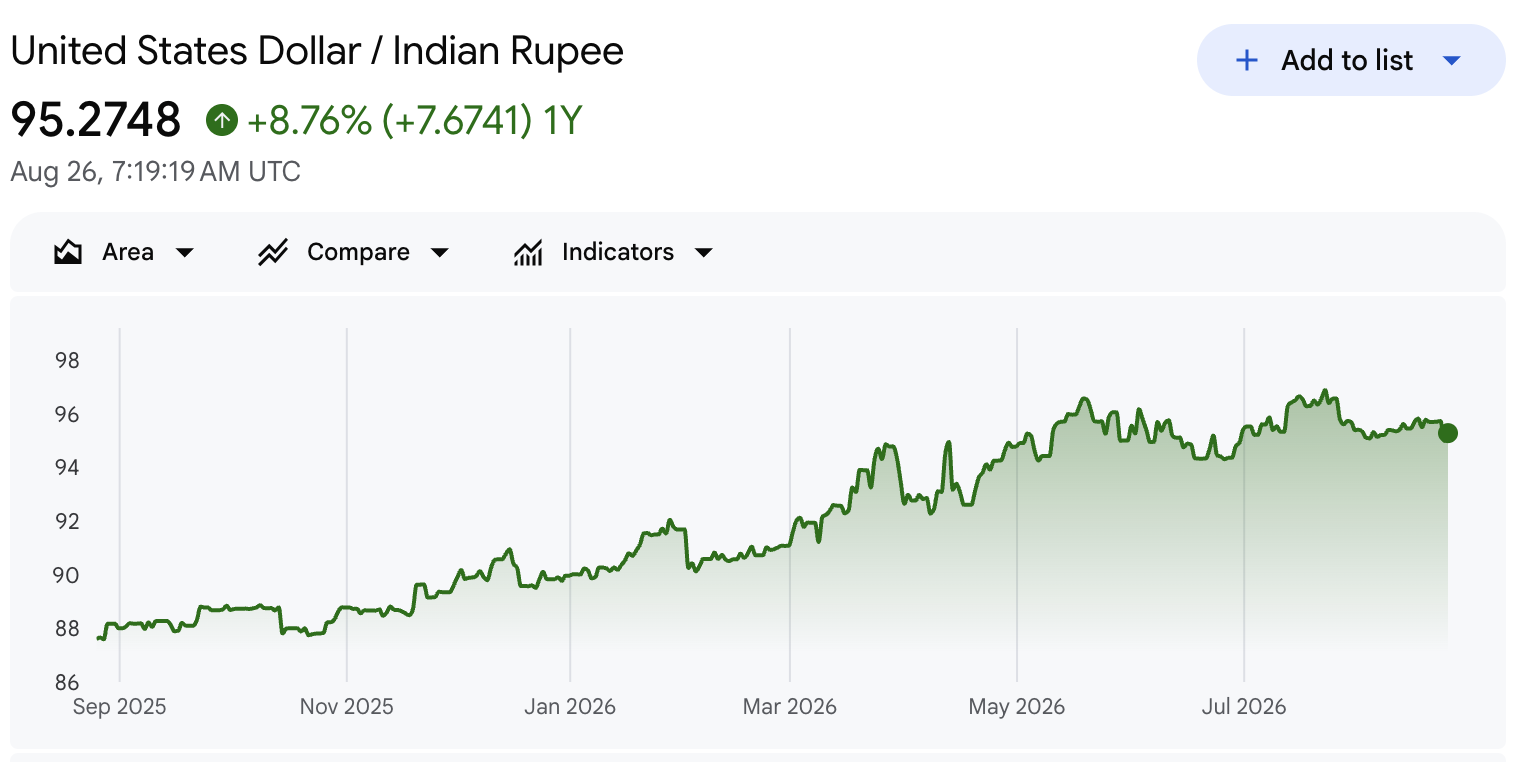
What follows is arithmetic rather than opinion. An American who buys Indian shares earns in rupees but is paid in dollars. If the portfolio is flat in local terms and the rupee falls 6%, that investor still books a 6% loss on conversion. Nothing needs to go wrong in Mumbai for the position to bleed in New York.
For a fund such as INDA, the relationship collapses into a single line:
USD return ≈ local equity return + currency return + dividends − costs
| Scenario | Local return | Rupee vs USD | USD result |
|---|---|---|---|
| A | 0% | -6% | -6.0% |
| B | +5% | -6% | -1.3% |
| C | -3% | -6% | -8.8% |
Scenario C is close to what INDA holders lived through. A modest slip in Indian share prices, magnified by the currency, produces a headline loss approaching 9% with the domestic economy intact.
On a simplified attribution, rupee depreciation explains roughly two-thirds of the decline, before dividends, the 0.61% fee, Indian capital gains accruals and the fair-value effects BlackRock notes can separate fund from benchmark.
Currency is not the whole story, though. Another India fund met the identical exchange rate this year and still finished in positive territory.
INDA trades at 22.69 times earnings and 3.29 times book. Neither is extravagant by Indian standards, yet both stand above most emerging-market comparators, and that premium has rested on demographics, rising consumption, the formalisation of commerce and a long runway of structural expansion.
Premiums compress. Through 2025 and into 2026, global capital rotated toward cheaper markets where earnings were accelerating faster, and India’s relative multiple narrowed accordingly.
Corporate profits lagged the economy for several quarters, leaving the entry price harder to defend than the growth rate implied. Strong output does not shield an ETF when the starting multiple already assumes years of it.
Valuation explains the willingness to sell. Flows explain the selling.
Foreign portfolio investors were net sellers of Indian equities in every month of the first half except February, and the scale was unusual.
March alone drained ₹1,17,775 crore. April, May and June each shed between ₹33,000 crore and ₹61,000 crore, without a month of respite. The tide turned in July, and August has extended the buying. Even so, the cumulative outflow of roughly ₹2.3 trillion exceeds the ₹1.66 trillion withdrawn in all of 2025.
It punishes a dollar investor twice. Selling drags share prices down directly, and capital leaving the country lifts demand for dollars, which weakens the rupee again. Weaker equities, weaker currency, weaker dollar return: the loop feeds itself until sentiment breaks the circuit.
Here the investigation turns specific. India’s most vigorous FY26 growth arrived in narrow, capital-intensive industries. The fund’s published holdings tell a different story.
| Growth theme | FY26 momentum | Representation in INDA |
|---|---|---|
| Electronics manufacturing | Output up 15.8% to ₹13.11 lakh crore | Under 1% in pure-play names |
| Defence production | Record ₹1.78 lakh crore, up 15.6% | About 2%, across three holdings |
| Power equipment and grid | Sustained capex, full order books | About 3% |
| Global capability centres | Record services exports | Largely captive to foreign parents and not directly investable; listed IT is 7.1% |
| Rail infrastructure | Continued public investment | Indirect only, via diversified engineering |
| Banking and lending | Mature, but central | 30.2%, the largest bloc |
Theme weights are our own aggregation of BlackRock’s INDA holdings file dated 21 August 2026; BlackRock reports standard sector classifications, not themes. Holdings are assigned to a single theme by primary business exposure at full weight, and diversified conglomerates are excluded rather than split.
The five largest positions are HDFC Bank at 6.17%, Reliance Industries at 6.02%, ICICI Bank at 5.60%, Bharti Airtel at 4.01% and Infosys at 2.56%. Add Axis Bank, Bajaj Finance, Kotak Mahindra Bank and Larsen & Toubro, and the character of the portfolio is settled.
None of this indicts those companies. Several rank among the best-capitalised franchises in Asia. The analytical point is narrower. INDA is a large-cap market portfolio, not a portfolio of India’s fastest-growing industries. Buying it is a position on Indian credit, energy and consumption more than on the Indian factory floor.
The cleanest proof that composition is doing real work comes from within the same fund family. The iShares MSCI India Small-Cap ETF (SMIN) has returned 1.96% this year against INDA’s -8.6%, a spread of 10.6 percentage points. Both funds convert from the same rupee. If currency were the whole explanation, the two should have suffered alike. They did not.
Smaller Indian companies carry heavier weights in industrials, capital goods, healthcare and domestic niches. SMIN allots 19.8% to industrials against INDA’s 10.9%, and only 17.0% to financials. That tilt has sat far closer to where FY26 growth actually happened.
The caveat is real. SMIN trades at 32.71 times earnings, carries three-year volatility of 18.8% against INDA’s 14.1%, and holds less liquid securities. The comparison is not a ranking. It shows that India’s growth looks different depending on which slice of the market a fund owns.
Four forces explain the gap:
Currency. A rupee decline near 6% removed most of the return before local performance was counted.
Valuation. India’s premium multiple compressed as global capital found faster earnings growth elsewhere.
Flows. Roughly ₹2.3 trillion of net foreign selling pressed on both share prices and the currency.
Composition. The index is anchored in lenders and large caps, not in the industries growing fastest.
INDA is down because investors are not buying India’s GDP. They are buying a dollar-denominated portfolio of predominantly large-cap Indian stocks, and in 2026 the currency, the valuations, the capital flows and the index construction have collectively outweighed the headline growth rate.
Predicting the fund is a poor use of attention. Watching four variables is better.
A steadier rupee. The Reserve Bank of India held its repo rate at 5.25% in August, and reserves stood near $693 billion at the end of July. If the currency holds, the translation drag lifts at once.
Durable foreign inflows. July and August delivered net buying after four punishing months. A sustained reversal would support share prices and the rupee together.
Earnings that catch the economy. For INDA to catch up with the economic narrative, stronger growth ultimately needs to translate into stronger earnings for the companies the fund owns.
A gentler multiple. Further price weakness without earnings deterioration would leave the entry valuation less demanding.
The constructive combination is improving earnings, a stable currency and returning capital. Should GDP alone stay strong while the rupee and the multiple deteriorate, INDA can lag the economic narrative indefinitely.
India’s economy can grow strongly while INDA falls because the two travel along separate circuits.
National output flows into wages, unlisted firms, tax receipts and the informal sector. ETF returns flow through listed share prices, an index rule deciding which companies qualify, foreign capital and an exchange rate. In 2026 the last three moved against the holder while the first held firm.
The lesson travels beyond India. A country ETF is not a claim on national output. It is a claim on a rules-based slice of a stock market, denominated in a currency the investor does not control. Knowing what the fund owns, which currency ultimately pays, and what is already embedded in the price will explain the next twelve months better than any headline growth rate.