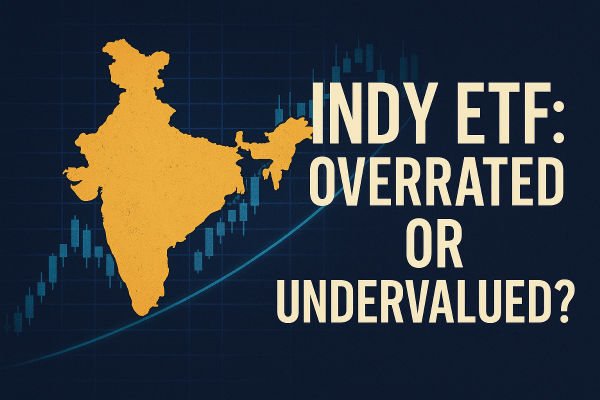
India has become one of the most watched economies among emerging markets. Its economic strength has raised the profile of domestic companies as well as global investment vehicles seeking to capture India’s momentum. Among these, the INDY ETF is a leading choice for international investors wanting exposure to India’s growth.
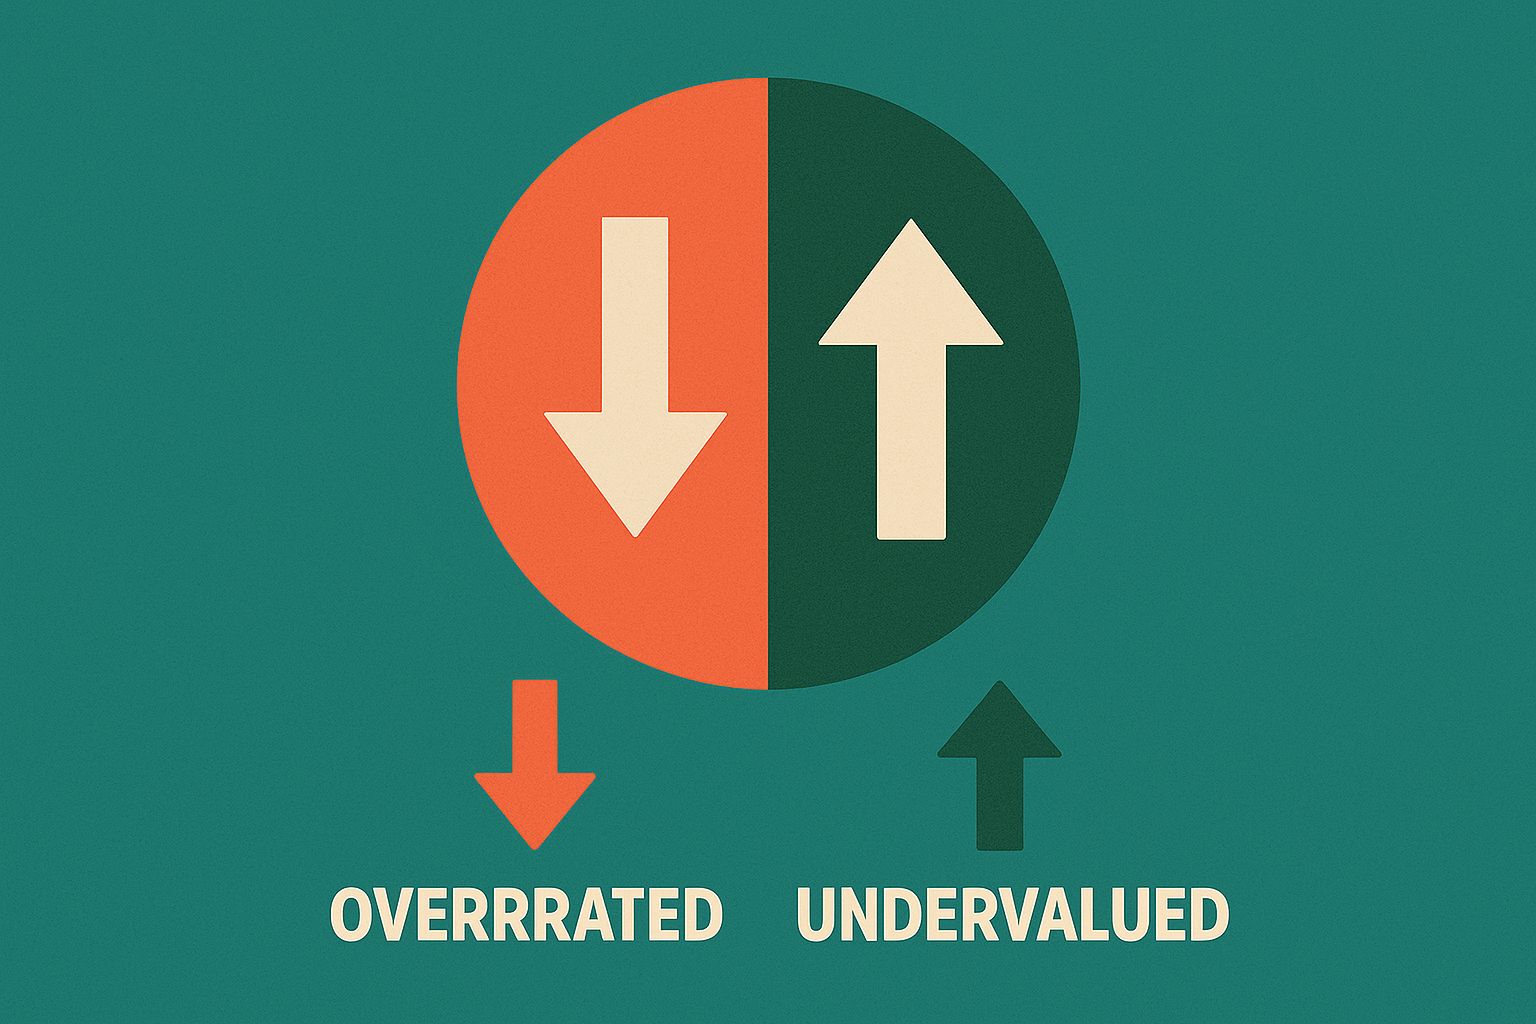
Over the past few years, foreign investors have poured billions into Indian equities, drawn by the country’s resilience, youthful workforce, and expanding technology and manufacturing sectors. The INDY ETF, a fund that tracks India’s largest companies, has ridden this wave of enthusiasm. Yet as valuations soar, a fundamental debate emerges: does the INDY ETF accurately mirror the substance of India’s long-term economic promise, or is it buoyed by an exuberance that risks outpacing reality?
Understanding the INDY ETF
The INDY ETF, formally known as the iShares India 50 ETF, is issued by BlackRock under its iShares product line. It provides investors with exposure to the Nifty 50 Index, a benchmark comprising fifty of India’s largest and most liquid companies listed on the National Stock Exchange of India (NSE).
This ETF is passively managed, meaning it seeks to replicate the performance of the index rather than outperform it through active stock selection. It trades on the NYSE Arca, giving global investors a straightforward way to invest in Indian blue-chip stocks without directly entering India’s local exchanges.
Key facts about the fund include:
Inception year: 2009
Assets under management (AUM): approximately USD 700 million as of 2025
Expense ratio: around 0.89 per cent
Average daily volume: roughly 150,000 shares
Dividend yield: about 1.2 per cent
Through the INDY ETF, investors gain access to powerhouse names like Reliance Industries, HDFC Bank, ICICI Bank, Infosys, and Tata Consultancy Services (TCS). Together, these companies represent the backbone of India’s economy and account for a large share of the country’s equity market capitalisation.
India’s Economic Momentum: The Story Behind INDY
The strength of the INDY ETF cannot be separated from India’s broader economic narrative. Over the past decade, India has transformed from an emerging economy to one of the world’s fastest-growing major markets.
According to the International Monetary Fund, India’s GDP growth averaged 6 to 7 per cent annually between 2014 and 2024, even amid global disruptions such as the pandemic and commodity shocks. The country now contributes more than 15 per cent of global growth, placing it behind only China and the United States.
Several structural forces underpin this momentum:
Demographics: India’s median age is 28, compared to 38 in the United States and 39 in China. A young, urbanising population provides long-term consumption potential.
Manufacturing shift: With multinationals diversifying supply chains, India has become a key alternative hub under the “Make in India” initiative.
Digital expansion: Over 700 million internet users and one of the world’s fastest-growing fintech ecosystems have boosted productivity and transparency.
Capital markets reform: Liberalised foreign ownership rules and digital trading infrastructure have attracted record inflows into Indian equities.
The result is an equity market that now exceeds USD 4 trillion in capitalisation, supported by rising corporate earnings and expanding investor participation. The INDY ETF captures this growth through its concentrated exposure to the Nifty 50’s largest players.
Inside the Fund: Sector and Stock Breakdown
The INDY ETF offers a snapshot of India’s economic composition through its holdings. Financial services dominate the index, reflecting India’s banking-led growth model and expanding consumer credit market.
Sector allocation (approximate, 2025):
Financials: 35 per cent
Information Technology: 15 per cent
Energy: 10 per cent
Consumer Goods: 8 per cent
Industrials: 7 per cent
Healthcare: 5 per cent
Materials and others: remaining 20 per cent
Top holdings include:
Reliance Industries
HDFC Bank
ICICI Bank
Infosys
TCS
Larsen & Toubro
Axis Bank
Hindustan Unilever
Bharti Airtel
State Bank of India
These ten names make up nearly 60 per cent of total assets, giving the fund significant concentration in a handful of corporate giants. While this structure magnifies exposure to India’s biggest success stories, it also introduces risk: a downturn in a major sector such as banking or energy could heavily impact returns.
The ETF’s methodology ensures that the portfolio is rebalanced semi-annually, following any changes in the Nifty 50’s constituents or their weightings.
Historical Performance: Hype or Substance?
Performance is where perception meets reality. The INDY ETF’s returns tell a story of long-term growth punctuated by short-term volatility.
Average returns (as of mid-2025):
1-year return: approximately 17 per cent
3-year annualised return: roughly 12 per cent
5-year annualised return: about 9 per cent
10-year annualised return: around 6 per cent
Over the same decade, the MSCI Emerging Markets Index returned about 3 per cent annually, while the S&P 500 delivered closer to 10 per cent. In that context, INDY’s returns place it near the top tier of emerging-market ETFs, though still below developed-market benchmarks.
Volatility remains high, with a standard deviation near 20 per cent and a Sharpe ratio of 0.4, indicating moderate risk-adjusted performance. Investors who bought during market dips have enjoyed strong gains, but those entering at peak valuations have faced longer recovery periods.
Currency movements also play a role. The Indian rupee has historically depreciated against the US dollar by an average of 2 to 3 per cent annually, which can offset a portion of local-market returns for international holders.
The Bearish View: Why the INDY ETF Might Be Overrated
Despite its strong track record, sceptics argue that the INDY ETF’s appeal is partly fuelled by enthusiasm rather than pure fundamentals. Let’s look at the three main concerns.
1. Elevated valuations
India’s equity markets are not cheap. The Nifty 50 trades at around 21 times forward earnings, compared to the MSCI Emerging Markets average of roughly 13 times. This valuation gap suggests investors are pricing in years of future growth and stability, leaving limited room for disappointment.
2. Concentration risk
With over a third of assets in financial stocks, the INDY ETF is vulnerable to sector-specific shocks. A sudden tightening of credit, regulatory intervention, or decline in loan quality could hurt banks and weigh on the entire fund. Furthermore, heavy exposure to a few conglomerates such as Reliance Industries and HDFC Bank makes the fund less diversified than many global ETFs.
3. Currency and liquidity concerns
While India’s capital markets have matured, the rupee remains volatile. In periods of global risk aversion, foreign investors often repatriate funds, pushing the currency lower. This can erode dollar-based returns. Additionally, trading volumes in US hours are thinner than in local markets, which can occasionally widen bid-ask spreads for INDY shares.
The Bullish View: Why INDY Might Still Be Undervalued
Supporters of the INDY ETF argue that short-term criticisms obscure a powerful transformation underway. For them, the main argument is that INDY is grounded in India’s structural growth, not just investor optimism. Their case rests on three pillars.
1. India’s structural growth story
Few countries combine scale, demographics, and reform potential like India. The government’s investment in infrastructure, renewable energy, and manufacturing has created a foundation for multi-decade growth. India’s working-age population will expand by more than 100 million over the next decade, and rising wages are fuelling domestic consumption. For global investors seeking diversification beyond China, India offers a unique blend of democracy, digitalisation, and demand.
2. Corporate earnings on the rise
After years of stagnation, Indian corporate profits have rebounded sharply since 2022. The banking sector has cleaned up non-performing loans, while technology exporters such as Infosys and TCS benefit from global digital demand. Earnings for Nifty 50 companies grew nearly 25 per cent year-on-year in 2024, outpacing most Asian peers. Strong profit momentum often justifies higher valuations, and the INDY ETF captures these blue-chip names directly.
3. Accessibility and transparency
For foreign investors, the INDY ETF removes barriers such as currency conversion, local account opening, and taxation complexity. It provides instant diversification within India’s top companies under US regulatory oversight. Compared to actively managed India funds, it also has lower costs and greater liquidity, allowing tactical as well as long-term positioning.
Key Facts and Metrics Every Investor Should Know
Before investing, it helps to look at the INDY ETF’s key statistics.
AUM: ≈ USD 700 million
Average daily trading volume: ≈ 150,000 shares
Price-to-Earnings ratio: ≈ 21x
Price-to-Book ratio: ≈ 3.4x
Dividend yield: ≈ 1.2%
Tracking error: ≈ 0.4%
Rebalancing frequency: Semi-annual
Top sector exposure: Financials (≈ 35%)
These figures suggest that the INDY ETF is costlier and more concentrated than many emerging-market peers but also offers access to high-quality, liquid equities.
Risks and Considerations
Like any emerging-market investment, the INDY ETF carries specific risks investors should evaluate carefully. Market volatility can be significant during global downturns or domestic political events, making it unsuitable for short-term speculation. Because INDY is heavily weighted toward a few sectors, it may not deliver the same diversification benefits as broader ETFs.
Currency exposure remains a defining factor. A weakening rupee can offset equity gains, while a stronger dollar cycle could reduce returns for foreign investors. Expense ratios, at around 0.9 per cent, are higher than average for passive funds but justified by the ETF’s niche focus and regulatory oversight.
The key takeaway: INDY rewards investors who view India as a multi-year opportunity rather than a quick trade.
Future Outlook
Looking ahead, the INDY ETF’s trajectory will hinge on India’s ability to sustain growth while managing inflation and fiscal discipline. Several long-term themes could support continued performance:
Manufacturing renaissance: Global supply chains are diversifying, and India is emerging as a preferred destination for electronics, auto components, and pharmaceuticals.
Infrastructure push: Government and private investments are modernising roads, railways, and logistics networks.
Financial deepening: Rising household savings and expanding mutual fund participation are driving more domestic liquidity into equities.
Technological innovation: With a strong base in software exports and startups, India is positioning itself as a digital powerhouse.
If these trends persist, India’s corporate earnings could maintain double-digit growth for years. Yet, valuations must eventually align with fundamentals. For now, the INDY ETF reflects optimism, perhaps not unfounded, but demanding continued execution from India’s corporate leaders.
FAQs About INDY ETF
Q1. What index does the INDY ETF track?
It tracks the Nifty 50 Index, which represents the fifty largest and most liquid companies listed on India’s National Stock Exchange.
Q2. Is the INDY ETF a good way to invest in India?
Yes, for investors seeking convenient access to India’s large-cap equity market. It offers transparency and liquidity but should be approached with awareness of currency and valuation risks.
Q3. How often does the INDY ETF rebalance?
The ETF follows the Nifty 50’s schedule, which rebalances semi-annually in March and September to reflect changes in index composition.
Conclusion
The debate over whether the INDY ETF is overrated or undervalued ultimately depends on perspective. If one judges it purely by valuations, the fund may look expensive compared to other emerging markets. But if one focuses on fundamentals, demographics, and long-term growth, INDY embodies a market with genuine potential.
Investors should view it as a vessel navigating India’s economic tide — steady, sometimes turbulent, but powered by deep undercurrents of progress. Patience, diversification, and discipline remain essential, but for those with a long horizon, the INDY ETF may be less a fleeting wave and more a durable channel toward one of the world’s most promising growth stories.
Disclaimer: This material is for general information purposes only and is not intended as (and should not be considered to be) financial, investment or other advice on which reliance should be placed. No opinion given in the material constitutes a recommendation by EBC or the author that any particular investment, security, transaction or investment strategy is suitable for any specific person.
