Published on: 2026-08-14
Updated on: 2026-08-14
ETF inflows and outflows can reveal where capital is moving, but a large daily flow does not automatically predict the next move in stocks. On August 11, 2026, SPY absorbed $3.56 billion while QQQ lost $3.28 billion and SOXX shed another $1.54 billion. Yet XLK still attracted $242 million, and QQQ had taken in $10.18 billion during the previous week.
The stronger signal comes from persistence, scale relative to assets, and confirmation across comparable funds, not from a single dramatic session.
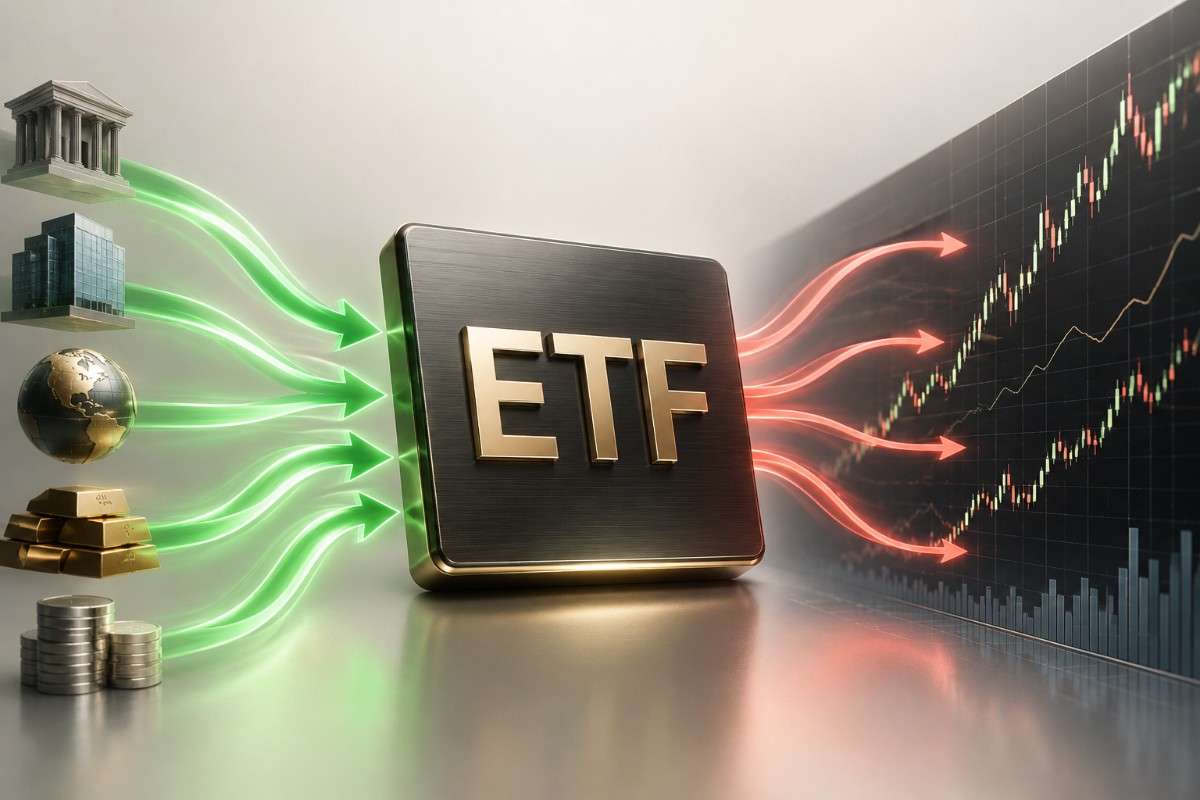
ETF creations and redemptions can affect trading in underlying securities, but fund flows and future returns are separate signals.
Flow relative to assets under management (AUM), persistence across periods, and confirmation from comparable funds reveal more than the headline dollar amount.
QQQ lost $3.28 billion on August 11 after attracting $10.18 billion the previous week, weakening the case for a sustained growth-stock exit.
SOXX lost 3.64% of its assets in one session after a $3.70 billion weekly redemption, giving semiconductor flows the stronger rotation signal.
SPY gained $3.56 billion while fellow S&P 500 tracker IVV lost $1.01 billion, showing how fund-specific flows can diverge despite nearly identical market exposure.
ETF flows can affect underlying securities, but price impact and predictive power are different questions. Most ETF trading transfers existing shares between market participants, while net fund flows arise when shares are created or redeemed in the primary market. Those transactions can require buying or selling securities in the underlying basket.
Creations may reflect new demand, while redemptions can arise from rebalancing, profit-taking, hedging or arbitrage. Neither mechanism guarantees what prices do next. An ETF can receive billions in inflows and still fall, or lose assets while its price continues rising.
QQQ’s $3.28 billion redemption on August 11 followed $10.18 billion of inflows during the week ending August 7. One day’s outflow does not establish a sustained exit from growth.
Technology flows were also split rather than uniformly negative. XLK attracted $242 million while SOXX lost $1.54 billion, narrowing the evidence of rotation to semiconductors rather than technology as a whole.
The contrast sharpens after adjusting for fund size and persistence.
| ETF | Aug. 11 Flow | Flow/AUM | Prior Week |
|---|---|---|---|
| QQQ | -$3.28B | -0.67% | +$10.18B |
| SOXX | -$1.54B | -3.64% | -$3.70B |
SOXX lost 3.64% of its assets on August 11 after another large redemption the previous week. QQQ reversed direction; SOXX did not.
SOXX was not isolated. SMH lost $1.80 billion during the week ending August 7, confirming that semiconductor outflows extended beyond one fund. The stronger evidence points to pressure in semiconductors, not a broad technology exit.
SPY, VOO and IVV all track the S&P 500, yet their flows moved in opposite directions. On August 11, SPY gained $3.56 billion and VOO gained $710 million while IVV lost $1.01 billion. The previous week reversed the pattern, with SPY losing $15.23 billion while VOO and IVV attracted $8.73 billion and $3.69 billion respectively.
The divergence shows why ETF flows cannot be treated as direct forecasts for the underlying index. Trading, hedging, liquidity and allocation needs can move billions between funds with the same benchmark without implying an equivalent change in the S&P 500 outlook.
A large flow becomes more informative when it persists, is meaningful relative to fund size, and is confirmed by comparable ETFs and market prices.
Persistence. One session can reverse quickly; repeated flows across several periods carry more weight.
Scale. Flow relative to AUM reveals intensity better than dollar size alone.
Confirmation. Similar ETFs moving in the same direction strengthen the case for genuine rotation.
Market breadth. Price action should agree, with more sectors or stocks participating in the same shift.
Mechanism. Rebalancing, hedging or lending can create large flows without signalling a new directional view.
The strongest signal is the one that survives across time, fund size, comparable ETFs and price action.
ICI data show domestic equity ETFs attracted about $26 billion between March 2 and March 13, 2020, even as U.S. stocks were collapsing during the COVID-19 selloff. Heavy inflows coexisted with falling equity prices rather than signalling an immediate bullish reversal.
Morningstar fund-flow data show ARKK received more than $2 billion in each of December 2020, January 2021 and February 2021 after gaining 152.5% in 2020. The fund then fell 34% from its February peak, showing how capital can arrive after exceptional returns have already attracted attention.
The two episodes expose opposite timing risks. March 2020 showed that inflows can persist during severe declines, while ARKK showed that heavy demand can arrive after a major rally. ETF flows become more informative when read alongside the price move that came before them.
Yes. New ETF shares can be created to satisfy securities-lending demand, including borrowing associated with short positions. The fund records additional shares outstanding even though the activity does not represent a straightforward bullish view. An inflow records creation activity, not the motive behind every trade.
Yes. ETF performance and fund flows measure different things. A fund can rise while shares are redeemed if its holdings appreciate, and it can fall while new shares are created. Flow direction alone does not determine return direction.
Trading volume measures ETF shares changing hands on an exchange. Fund flows reflect net creations or redemptions that change shares outstanding. An ETF can trade billions of dollars in one session without recording a similarly large inflow or outflow.
Daily flows capture immediate changes, while multi-day and weekly data show whether those changes persist. A large one-day outflow that reverses quickly carries less information than repeated redemptions across several periods and comparable funds.
Yes. A $1 billion redemption equals 5% of a $20 billion ETF but only 0.2% of a $500 billion fund. Flow as a percentage of assets puts the headline dollar amount in context.
Continued redemptions across multiple semiconductor ETFs, combined with weaker relative performance in the sector, would reinforce the August rotation signal. Renewed inflows into QQQ and major chip funds would weaken it.
A flow becomes a signal when the market confirms it.