Published on: 2025-10-28
Updated on: 2025-10-28
Every market has a heartbeat, and that pulse is found in its Depth of Market. For traders, it’s like peering behind the curtain to see how many buyers and sellers are competing at each price level. The more active the orders, the stronger the liquidity and stability of that market.
In essence, Depth of Market shows who is waiting to trade, at what price, and how much they’re willing to buy or sell. Understanding this invisible tug-of-war helps traders anticipate short-term price moves, identify support and resistance levels, and refine timing for their trades.

Depth of Market, also known as the order book, is a real-time list of all pending buy and sell orders for a financial asset. It displays price levels and the volume of orders on both sides of the market:
Bid side: Traders willing to buy.
Ask side: Traders willing to sell.
Each row in the DOM represents a price level, showing how much volume is waiting to be executed. For instance, if 200 units are waiting to buy at 1.1050 and 150 units to sell at 1.1052, the market is likely to trade within that narrow spread until new orders appear.
Prices in financial markets don’t move randomly; they respond to imbalances between buyers and sellers. When buy orders outweigh sell orders, prices tend to rise. When sell orders dominate, prices fall.
Depth of Market data captures this tug-of-war, showing traders where large clusters of orders sit. These clusters often act as liquidity zones, influencing how easily prices can move.
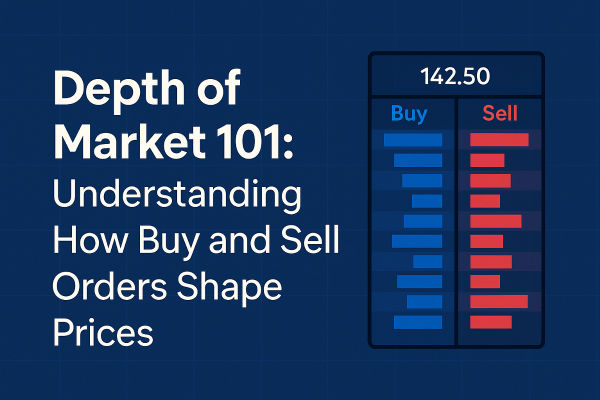
A standard DOM screen will show three main components:
Price Levels: Displayed vertically, with higher prices above and lower prices below.
Bid Volume: The total number of buy orders at each price level.
Ask Volume: The total number of sell orders at each price level.
When a large buy order appears on the bid side, it suggests strong demand at that price. Conversely, a large sell order on the ask side signals potential resistance.
Let’s say EUR/USD is trading near 1.1000. On the DOM, you notice a large cluster of buy orders between 1.0990 and 1.0992, totalling 10 million euros, but only 2 million in sell orders above 1.1010. This imbalance indicates stronger demand below the market. If prices dip toward 1.0990, buyers are likely to absorb the pressure and push it back up.
In contrast, if a huge block of sell orders appears at 1.1020, it might cap price advances until that liquidity is consumed. Traders use this insight to anticipate turning points or breakouts.
Liquidity refers to how easily an asset can be bought or sold without causing major price changes. DOM gives a visual measure of liquidity.
Deep liquidity: Many orders across multiple price levels mean smoother price movements.
Shallow liquidity: Few orders create volatility, as small trades can shift prices significantly.
In major forex pairs like EUR/USD, the DOM is deep, with thousands of orders per level. In smaller or exotic pairs, the DOM is thinner, meaning larger spreads and greater price jumps.
Short-term traders rely on DOM to detect where large institutions are placing orders. For example, when heavy buying appears suddenly, a scalper may ride the wave for a quick profit.
DOM helps pinpoint potential turning points. If buy orders repeatedly cluster at 1.1000, that level acts as psychological and technical support.
Seeing how liquidity shifts can guide when to enter or exit a position. Thin liquidity ahead of news events may signal caution, as prices can spike unpredictably.
Some traders place large visible orders without intention to execute, hoping to influence perception. Monitoring how orders appear and vanish can reveal such tactics.
During the 2010 “Flash Crash,” the US stock market plunged nearly 9 percent within minutes. One contributing factor was the sudden disappearance of buy orders from the DOM. Liquidity evaporated, and without enough buyers, prices collapsed. This event showed how critical market depth is for stability. When liquidity thins out, even small orders can cause huge moves.
Most trading platforms for professionals, such as MetaTrader 5, NinjaTrader, or TradingView, include a DOM window. Futures traders often use the DOM directly from exchange feeds like CME or Eurex.
For CFD and forex traders, brokers aggregate data from multiple liquidity providers to display an estimated market depth. While not identical to centralised exchange data, it still provides insight into price behaviour and order pressure.

While useful, DOM has its caveats:
Not all orders are displayed (hidden or iceberg orders exist).
Large institutions may execute trades through algorithms that split orders into smaller chunks.
DOM is more informative for short-term traders than for long-term investors.
Forex: Shows aggregated liquidity from multiple providers; helps detect thin conditions before major data releases.
Futures: Directly reflects exchange order books, offering transparency for volume analysis.
Stocks: Order book varies by exchange, with visible bids and asks tied to volume and time priority.
No. It is common for forex, futures, and equities but less transparent for over-the-counter products.
Continuously. Most platforms refresh multiple times per second to show real-time liquidity changes.
It offers clues but not certainties. It shows supply and demand zones, but large players may alter orders instantly, making prediction complex.
Depth of Market bridges the gap between price charts and real liquidity. While charts show where prices have been, DOM shows where they might go next by revealing live order activity.
For traders, mastering DOM means understanding not just what the market has done, but what it’s preparing to do. Used alongside price action and volume analysis, it provides an edge in timing trades and gauging momentum.
Bid: The price buyers are willing to pay.
Ask: The price sellers are willing to accept.
Spread: The difference between bid and ask prices.
Liquidity: The ease with which assets can be traded without major price changes.
Order Book: The digital record of all active buy and sell orders.
Disclaimer: This material is for general information purposes only and is not intended as (and should not be considered to be) financial, investment or other advice on which reliance should be placed. No opinion given in the material constitutes a recommendation by EBC or the author that any particular investment, security, transaction or investment strategy is suitable for any specific person.