Published on: 2025-02-19
Updated on: 2026-07-01
The hammer candlestick pattern is one of the clearest signals that selling pressure may be losing control. It appears after a decline, when price drops sharply during a session but recovers to close near the top of the candle.
Yet a hammer is only a warning that selling pressure may be fading. Traders still need confirmation, context, and risk management before treating it as a reversal signal. Used correctly, the hammer helps identify potential turning points without guessing where the bottom is.
A hammer candlestick is a bullish reversal pattern that forms after a downtrend or pullback.
The lower wick should usually be at least twice the size of the real body.
The pattern works best near support, moving averages, trendlines, or Fibonacci retracement levels.
A confirmed hammer normally needs the next candle to close above the hammer high.
Placing a stop-loss below the hammer low gives traders a clear invalidation point.
Hammer and inverted hammer patterns can both be bullish, but they show different price behaviour.
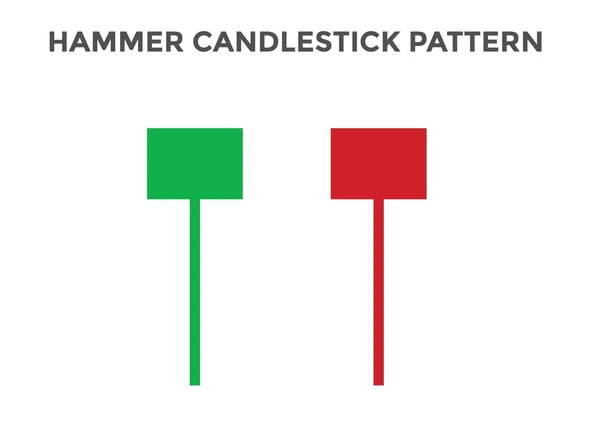
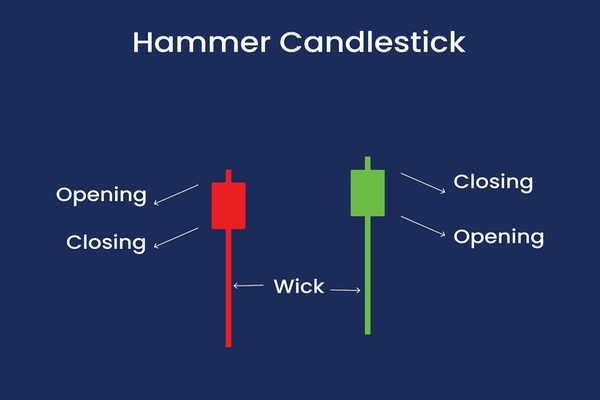
A hammer candlestick pattern is a single-candle formation that signals a possible shift from bearish pressure to bullish recovery. It has a small real body near the top of the candle, a long lower shadow, and little or no upper shadow.
The candle can be green or red. Many traders prefer green hammers because they show buyers regained control strongly enough to close above the opening price. However, a red hammer can still signal a bullish reversal if the overall structure and location are favourable.
The hammer must appear after a decline. If the same candle shape appears after an uptrend, it is usually called a hanging man and may warn that upside momentum is weakening.
A valid hammer needs more than a long wick. The full candle structure and its position on the chart both matter.
A strong hammer usually has these features:
It appears after a clear decline or pullback.
The real body is small and sits near the top of the candle range.
The lower shadow is at least twice the size of the body.
The upper shadow is very small or absent.
Price forms the candle near a meaningful technical level.
Price structure
major support levels
prior swing lows
rising trendlines
Technical indicators
20, 50, or 200-period moving averages
Fibonacci retracement levels
oversold zones on momentum indicators
Weak locations for a hammer
the middle of a trading range
areas with no obvious support
strong downtrends without signs of exhaustion
candles formed just before major economic releases
thin-liquidity periods where wicks are less reliable
In forex and CFD markets, centralised volume is limited, so traders often focus more on price location, wick rejection, and the next candle. In stocks and futures, volume can provide useful confirmation.
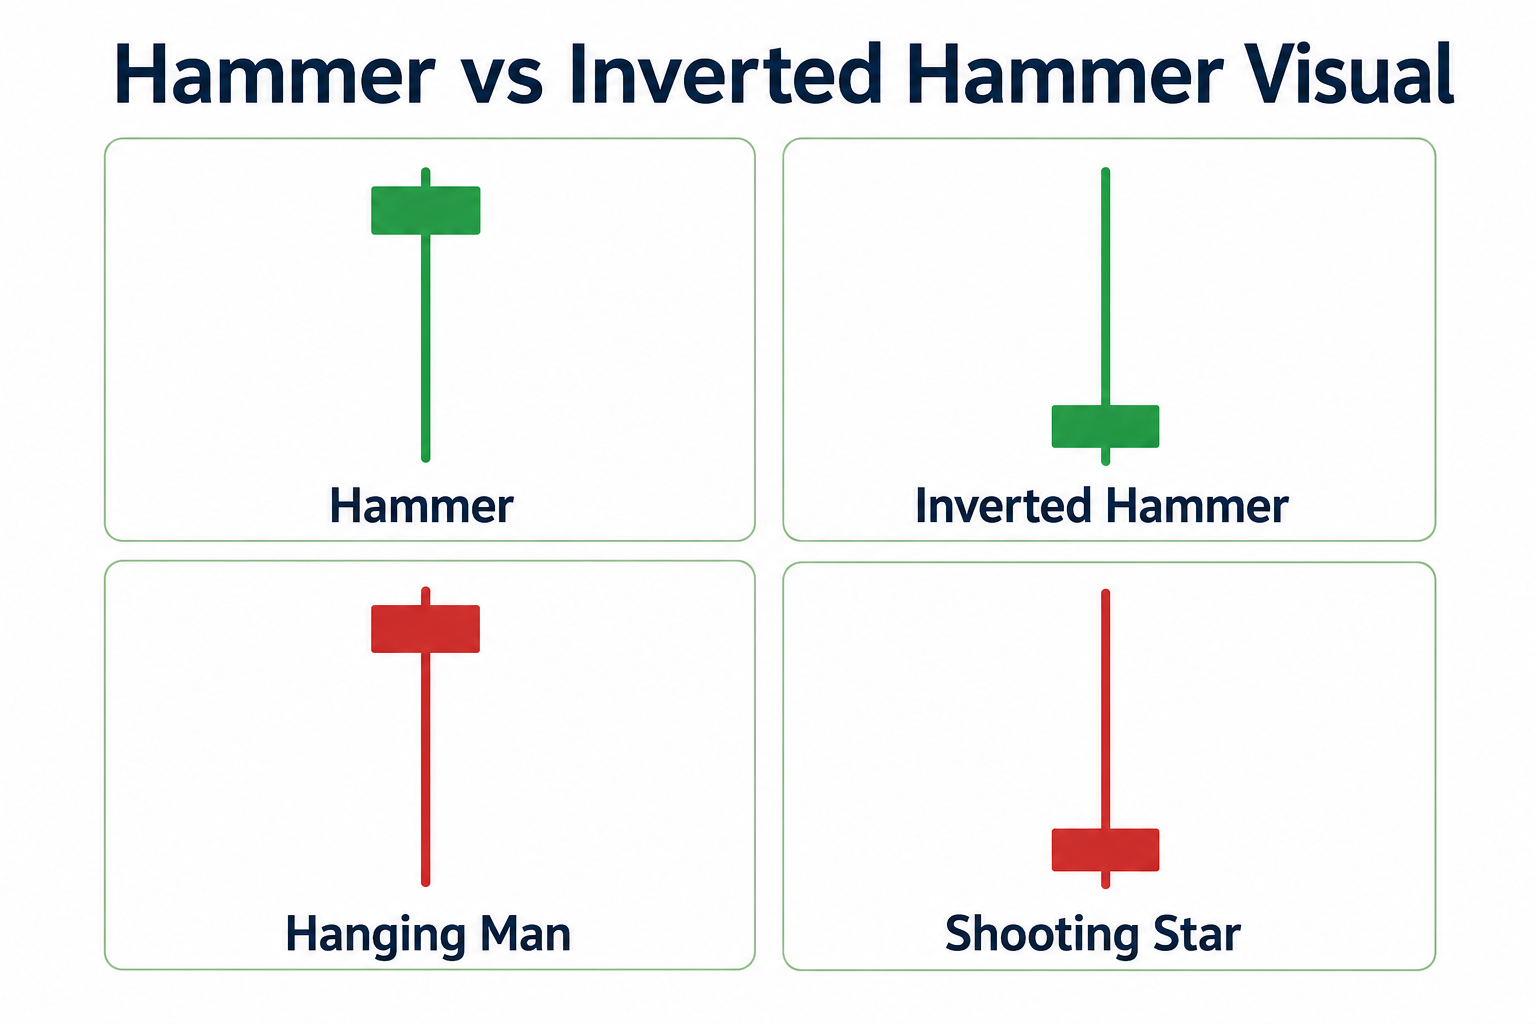
The hammer and inverted hammer are often confused because both can appear after a decline and both may signal bullish reversal potential. The difference is the wick.
A hammer has a long lower wick. An inverted hammer has a long upper wick. A hammer shows direct rejection of lower prices. An inverted hammer shows early upside pressure, but buyers still need confirmation.
| Pattern | Where It Appears | Shape | Meaning | Confirmation |
|---|---|---|---|---|
| Hammer | After a downtrend | Long lower wick, small body near the top | Lower prices are rejected | Close above the hammer high |
| Inverted Hammer | After a downtrend | Long upper wick, small body near the bottom | Buyers test upside pressure | Strong bullish candle after the pattern |
| Hanging Man | After an uptrend | Hammer shape | Sellers challenge the uptrend | Bearish close below the candle low |
| Shooting Star | After an uptrend | Inverted hammer shape | Buyers fail to hold higher prices | Bearish follow-through |
A hammer usually provides a cleaner reversal signal because the recovery happens inside the same candle. An inverted hammer requires more patience because the market has tested higher prices but has not yet closed strongly.
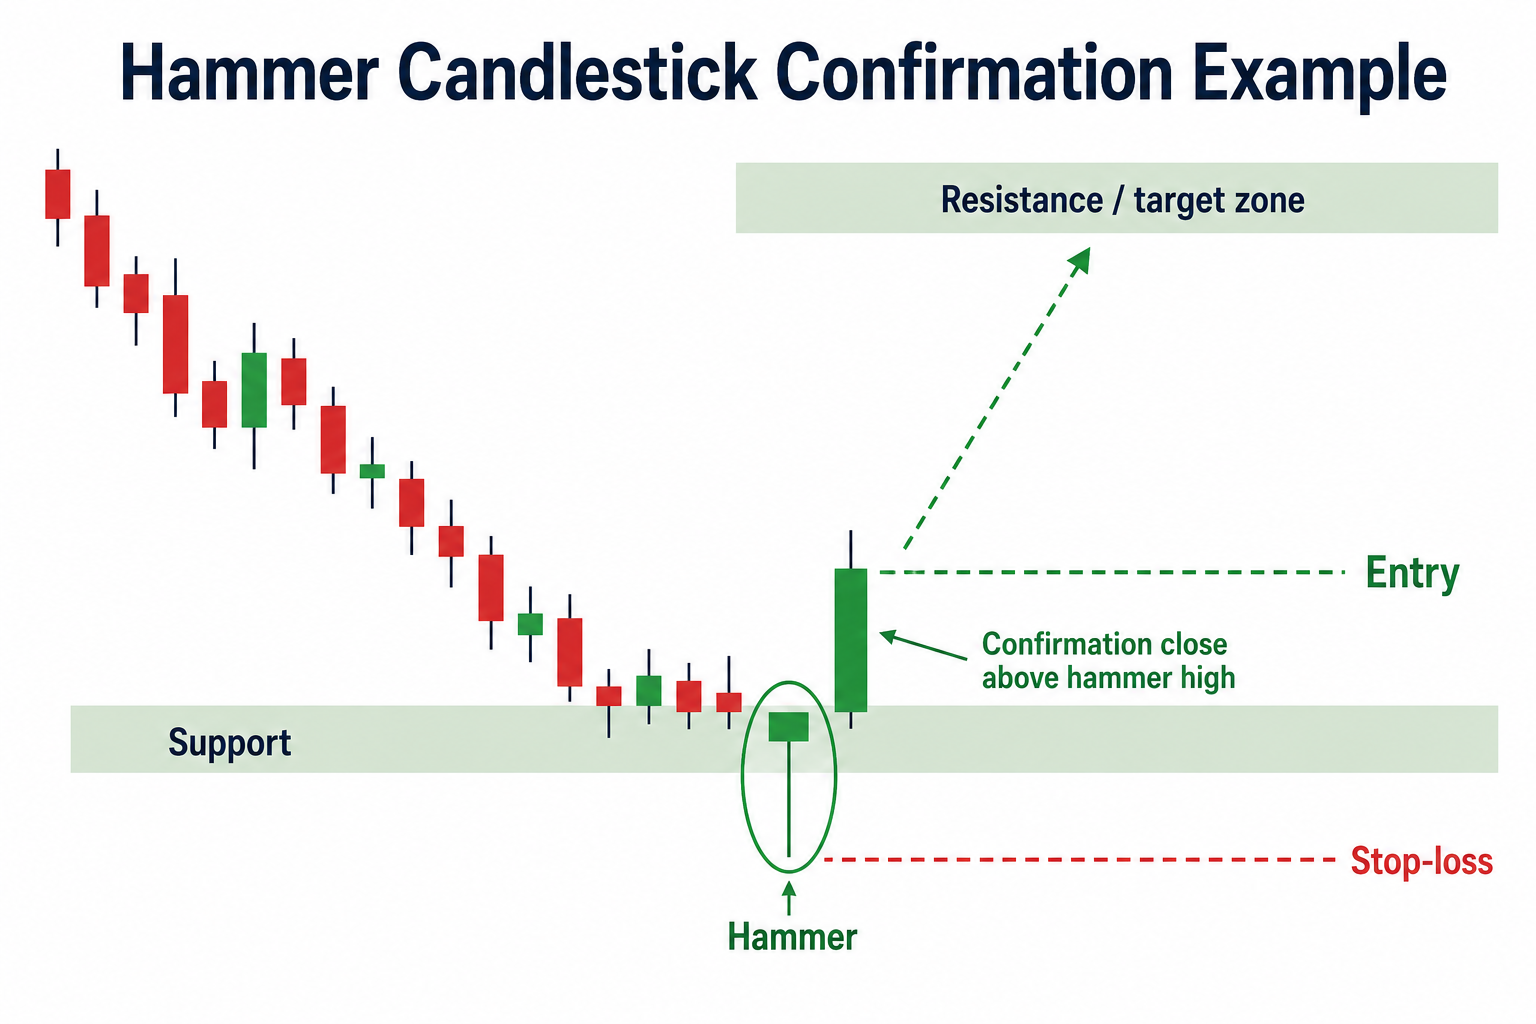
EUR/USD falls into a prior weekly support zone.
A hammer forms with a lower wick three times the body size.
The upper wick is small, showing limited rejection near the close.
The next candle closes above the hammer high.
Traders treat this as confirmation of a bullish reversal attempt.
The setup is more useful because the candle forms where buyers previously defended price.
Gold pulls back toward its 50-period moving average after a broader rally.
Price briefly breaks below the moving average during the session.
A hammer forms and closes back above the average.
RSI begins to recover from an oversold reading.
A long entry is considered only after price clears the hammer high.
GBP/USD forms a hammer within a choppy range.
There is no nearby support level.
The next candle fails to break above the hammer high.
Price then closes below the hammer low.
The setup is invalidated.
A failed hammer is often more useful as a warning than as a missed opportunity. If price breaks below the hammer low, the reversal attempt has failed.
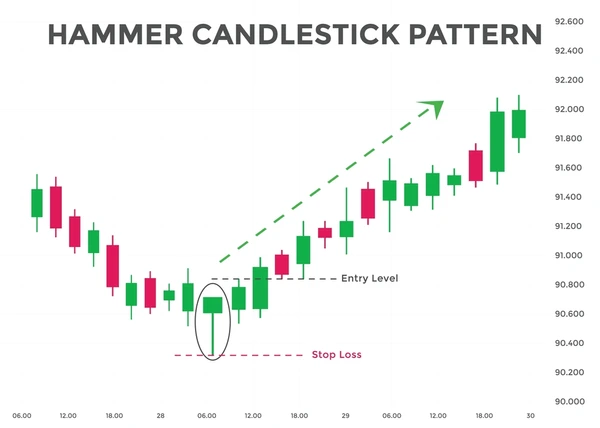
A hammer trade should follow a simple process. The setup needs a valid trend context, a strong chart location, confirmation, and a defined exit plan.
| Trading Step | Practical Rule |
|---|---|
| Trend Check | Only treat the hammer as bullish after a decline or pullback |
| Location | Prefer support, trendlines, Fibonacci levels, or moving averages |
| Entry Trigger | Enter after price closes above the hammer high |
| Stop-Loss | Place the stop below the hammer low |
| Take-Profit | Target the next resistance zone or use at least a 1:2 risk-reward ratio |
| Invalidation | Avoid or exit the setup if price closes below the hammer low |
Enter near the hammer close.
Provides a better entry price.
Carries a higher risk of failure because confirmation is missing.
Enter after a close above the hammer high.
Reduces false signals.
Usually requires paying a higher price.
Wait for a breakout above the hammer high and a retest.
Often provides cleaner risk management.
The trade may never trigger.
Indicators should not replace price action. They should help confirm whether the hammer appears in a sensible trading area.
Useful confirmation signals include:
Support and resistance: hammer forms at a major demand zone
RSI: oversold reading or bullish divergence
MACD: fading downside momentum or bullish crossover
Moving averages: hammer forms at dynamic support
Fibonacci: rejection near key retracement levels
Volume: above-average participation in stocks or futures
Support and resistance usually matter most. RSI and MACD can help confirm whether downside momentum is fading. Volume can strengthen the signal when market data is reliable.
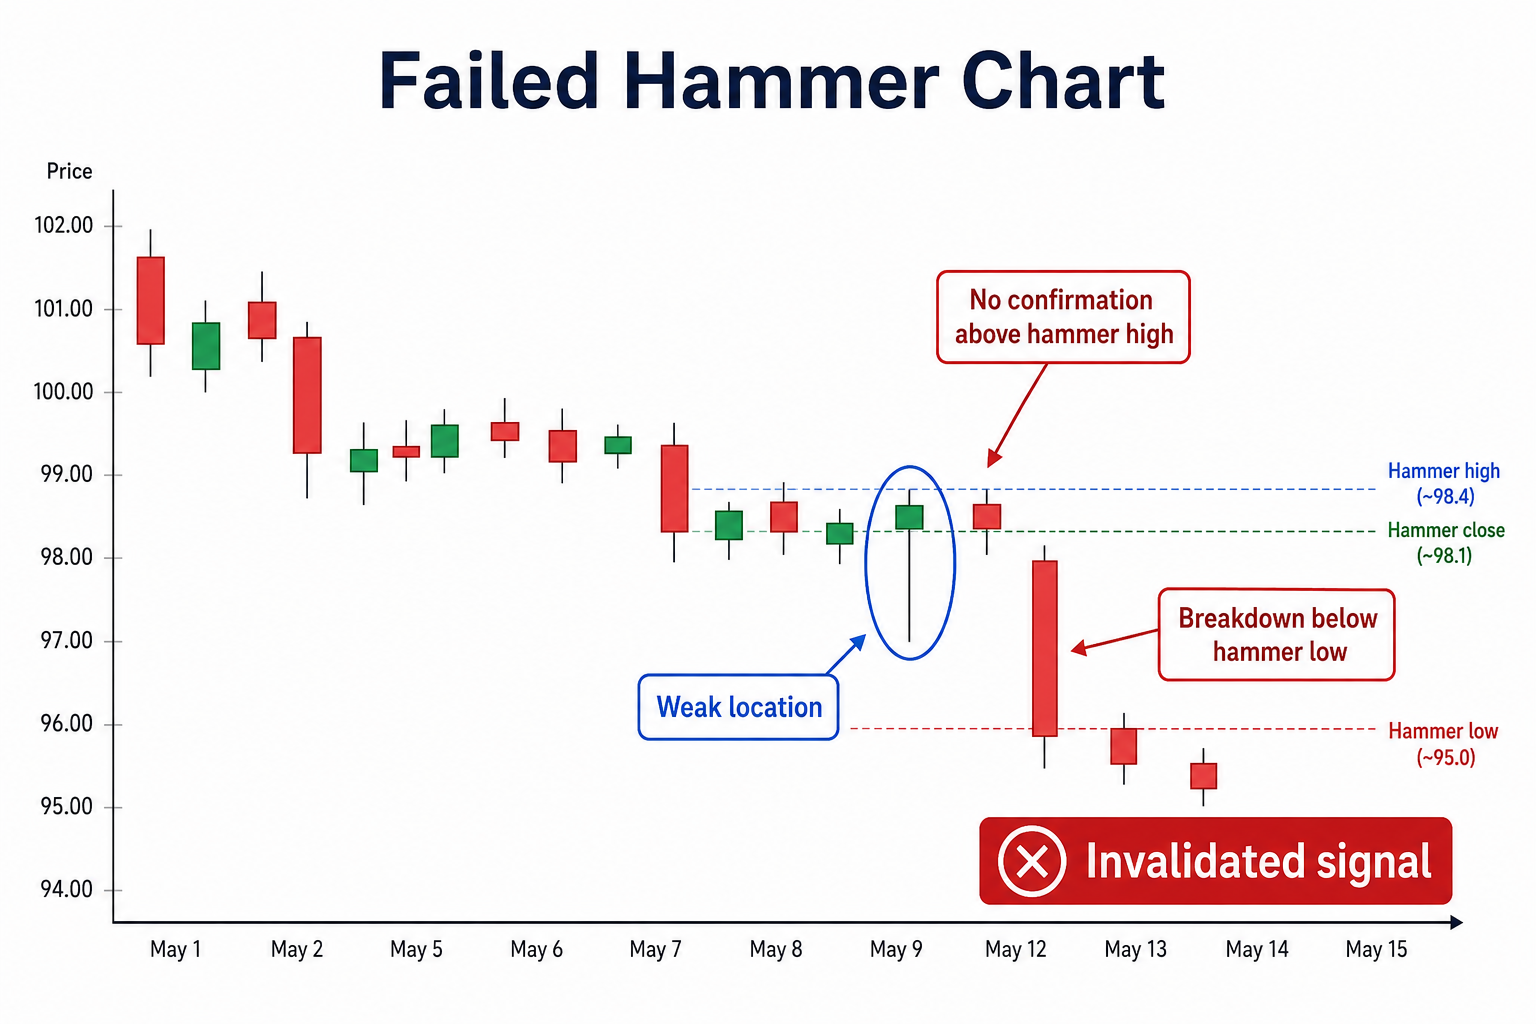
A hammer fails when price does not confirm the reversal or breaks the level that should have acted as support.
Common failure conditions include:
the hammer forms without a prior decline
the candle appears in the middle of a range
the next candle fails to close above the hammer high
price closes below the hammer low
resistance is too close to justify the trade
the wider trend remains strongly bearish
the signal appears before major news
Failed hammers can be useful because they reveal that buying pressure was insufficient to reverse the trend. In strong downtrends, that failure may invite fresh selling.
The most common mistake is treating every long lower wick as a hammer. A valid hammer needs the right shape and the right trend context.
Another mistake is entering before confirmation. A hammer shows potential, but the next candle decides whether buyers can extend the move.
Traders also ignore nearby resistance. If the hammer forms just below a major resistance level, the potential reward may be too small compared with the risk.
Stops that are too tight can also damage performance. The stop should sit below the hammer low, with enough room for normal volatility. If that makes the trade too risky, the setup should be skipped.
Major economic releases, central-bank decisions, and earnings announcements can invalidate technical patterns quickly. Traders should always check the event calendar before acting on a hammer signal.
The hammer candlestick pattern does not predict how far price will rise. It only identifies a possible reversal area.
It can also fail in strong downtrends. When bearish momentum is strong, a hammer may produce only a brief bounce before the decline resumes.
Timeframe matters. A hammer on a 5-minute chart may reflect short-term noise. A hammer on a daily or weekly chart carries more weight because it captures a broader shift in market behaviour.
A hammer works best when trend, support, confirmation, and risk-reward all align.
A hammer candlestick is usually bullish when it appears after a downtrend. If the same shape appears after an uptrend, it is called a hanging man and may signal bearish risk.
The most common confirmation is a candle closing above the hammer high. Traders may also look for support, rising volume, RSI recovery, MACD improvement, or a key moving average to be reclaimed.
A hammer has a long lower wick and shows rejection of lower prices. An inverted hammer has a long upper wick and indicates that buyers attempted to push the price higher. Both can be bullish after a downtrend, but the inverted hammer usually needs stronger confirmation.
A stop-loss is usually placed below the hammer low. This level acts as the invalidation point. If price breaks below it after confirmation, the bullish reversal setup has failed.
Yes, the hammer candlestick can work in forex, but it should be combined with support, resistance, trend structure, and confirmation. Since spot forex lacks centralised volume, price location and follow-through become especially important.
A hammer candlestick is not a prediction that price will reverse. It is evidence that selling pressure may be weakening. The best hammer setups appear after a decline, form at meaningful support levels, and are confirmed by bullish follow-through.
Traders who define entry, stop-loss, target, and invalidation before entering have a much better chance of using the pattern effectively. The hammer is simple, but it works best when traded with discipline.
Disclaimer: This material is for general information purposes only and is not intended as (and should not be considered to be) financial, investment or other advice on which reliance should be placed. No opinion given in the material constitutes a recommendation by EBC or the author that any particular investment, security, transaction or investment strategy is suitable for any specific person.