Published on: 2026-03-27
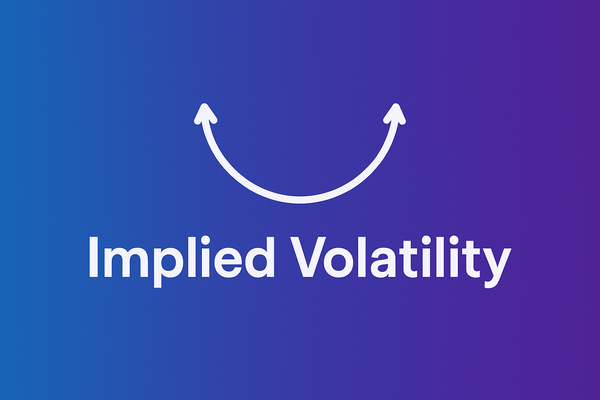
In options trading, implied volatility is one of the most important variables for pricing and risk assessment. However, contrary to traditional models, volatility is not constant across all options. Instead, it forms patterns known as the volatility smile and volatility skew.

These patterns reveal how the market prices risk at different strike prices and provide valuable insight into trader sentiment. Understanding the difference between volatility skew and volatility smile is essential for anyone involved in options trading, as it affects pricing, strategy selection, and risk management.
Volatility smile and volatility skew describe how implied volatility varies across strike prices.
A volatility smile is symmetrical, while a volatility skew is asymmetrical.
Skew reflects directional market bias, especially downside risk in equities.
Both concepts challenge the assumption of constant volatility in traditional models.
Traders use these patterns to interpret sentiment and improve strategy decisions.
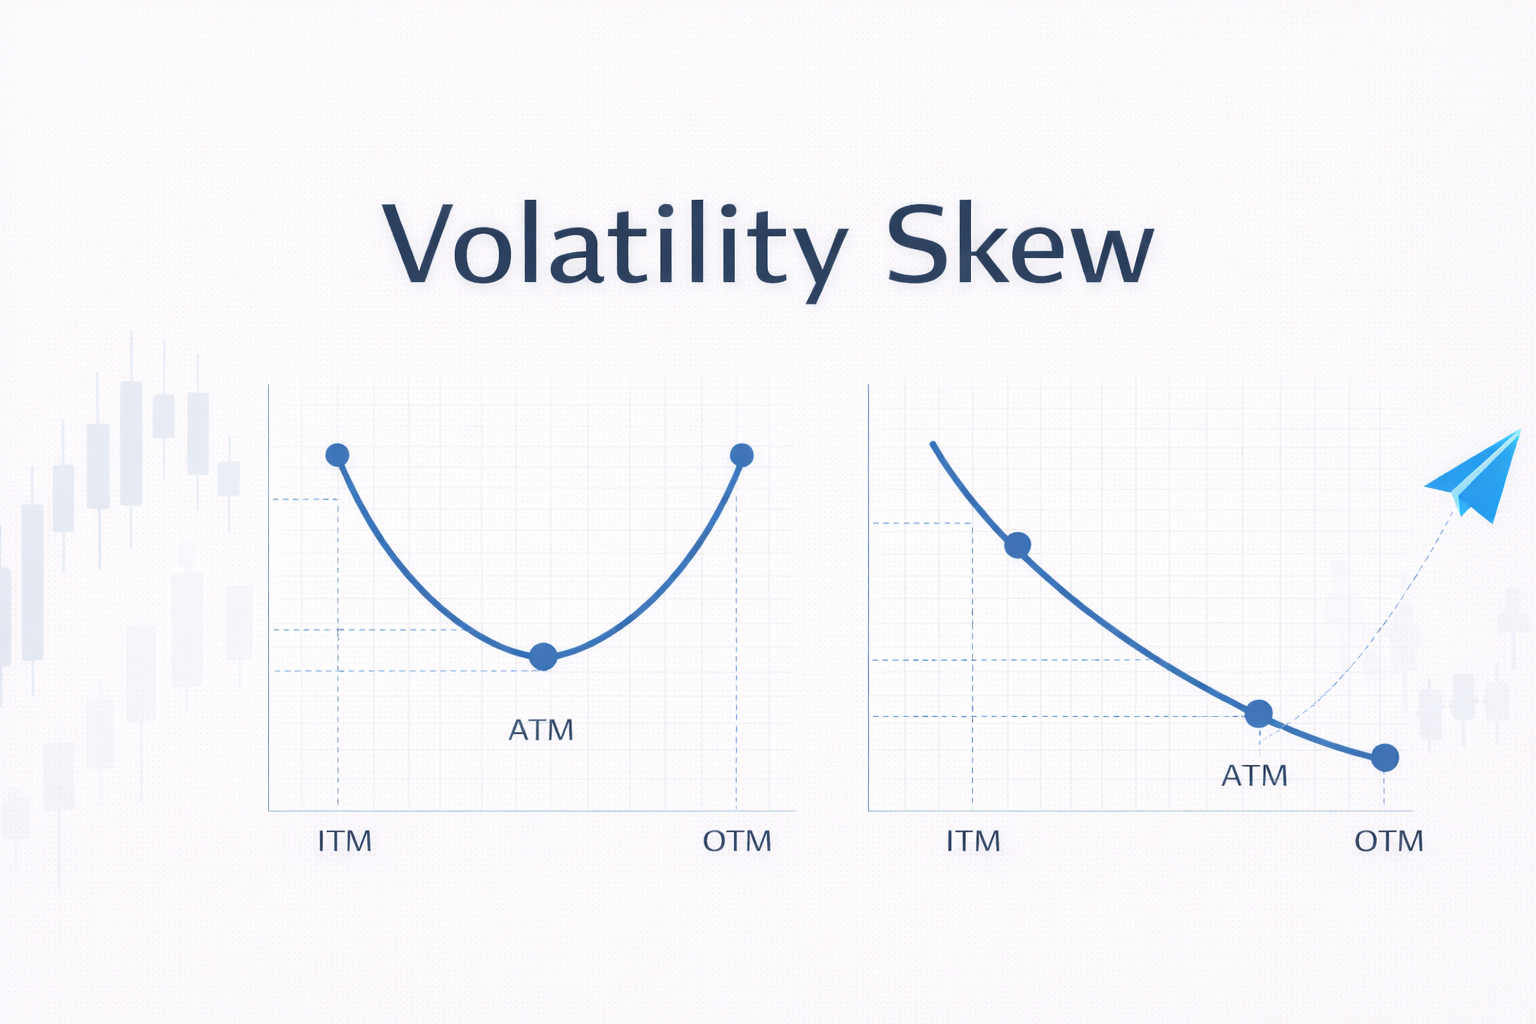
A volatility smile is a graphical pattern in which implied volatility is higher for both deep in-the-money and out-of-the-money options than for at-the-money options.
When plotted on a chart, this creates a U-shaped curve, resembling a smile.
This pattern suggests that the market expects larger price movements in either direction, meaning both extreme upside and downside scenarios are being priced in.
Several factors contribute to the volatility smile:
Expectation of extreme price moves in either direction.
Fat tail risk, where large price swings are more likely than traditional models assume.
Demand for out-of-the-money options as speculative or hedging tools.
Volatility smiles are more commonly observed in markets such as currencies and commodities, where price spikes can occur in both directions.
A volatility skew refers to an uneven distribution of implied volatility across strike prices.
Instead of a balanced curve, the graph slopes in one direction, creating an asymmetrical shape.
In equity markets, the most common form is a negative skew, where:
Out-of-the-money put options have higher implied volatility.
Call options have relatively lower implied volatility.
This creates a curve that slopes downward as strike prices increase.
Volatility skew is primarily driven by market behaviour and risk perception:
High demand for downside protection through put options
Fear of market crashes, which increases put option pricing
Institutional hedging activity, especially in equity markets
In a volatility smile, implied volatility is lowest near the current price and increases as you move away in either direction.

In a volatility skew, implied volatility increases more on one side, typically for lower strike prices in equity markets.

Both patterns emerge when plotting implied volatility against strike prices, forming part of what traders call the volatility surface.
Traditional models, such as the Black-Scholes model, assume constant volatility. However, real markets behave differently.
Options with higher demand, such as protective puts, naturally have higher implied volatility.
Markets price in the possibility of extreme events, especially downside crashes. This creates higher implied volatility for certain options.
Fear plays a significant role. Investors are generally more concerned about losses than gains, which contributes to skewed volatility patterns.
Understanding volatility skew and smile is not just theoretical. It has real trading implications.
Options Pricing Accuracy: Traders cannot rely on a single volatility input. Adjusting for skew or smile leads to more accurate pricing.
Strategy Selection: Different volatility structures favour different strategies:
Volatility Smile: Suitable for strategies expecting large moves, such as straddles
Volatility Skew: Useful for hedging and directional trades
Risk Management: A steep skew often signals heightened market fear. This can act as an early warning indicator for potential volatility.
In practice, volatility skew is more common than a perfect smile, especially in equity markets.
This is because investors consistently demand protection against downside risk. As a result:
Put options become more expensive.
Implied volatility rises for lower strike prices.
The curve becomes skewed rather than symmetrical.
This reflects a fundamental truth about markets. Losses tend to happen quickly, while gains are usually gradual.
Although skew dominates equity markets, volatility smiles can still appear under certain conditions:
In commodity markets where both price spikes and crashes are possible
During periods of extreme uncertainty
When both upside and downside risks are equally priced
This makes the smile more common in assets with two-sided risk exposure.
The main difference is shape. A volatility smile is symmetrical, while volatility skew is asymmetrical and reflects directional market expectations, usually indicating higher downside risk.
Equity markets show volatility skew because investors demand downside protection. This increases the price and implied volatility of put options relative to call options.
Volatility skew is more common, especially in stock markets. Volatility smiles are more often observed in commodities and foreign exchange markets.
Traders use volatility skew to assess market sentiment, price options more accurately, and design strategies that account for asymmetric risk.
Volatility skew does not predict crashes directly, but a steep skew often indicates increased fear of downside risk, which may signal higher market uncertainty.
Volatility skew and volatility smile are essential concepts in options trading that describe how implied volatility varies across strike prices. While the volatility smile reflects balanced expectations of extreme price movements, volatility skew highlights directional risk, particularly downside fear in equity markets. Understanding the difference between these patterns allows traders to interpret market sentiment more accurately, price options effectively, and develop better trading strategies.
Disclaimer: This material is for general information purposes only and is not intended as (and should not be considered to be) financial, investment or other advice on which reliance should be placed. No opinion given in the material constitutes a recommendation by EBC or the author that any particular investment, security, transaction or investment strategy is suitable for any specific person.