Published on: 2025-08-29
Updated on: 2026-04-15
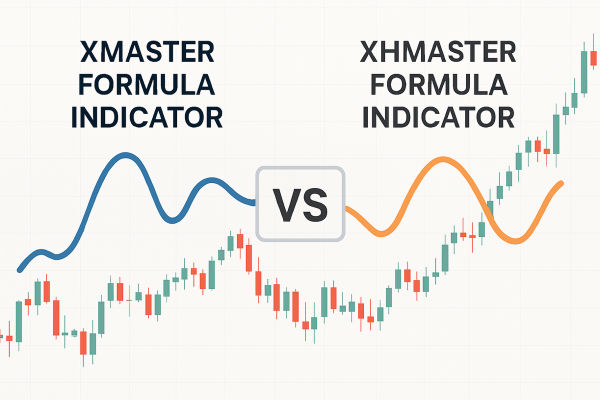
The Xmaster Formula Indicator and XHMaster Formula Indicator are custom MetaTrader indicators that combine common filters such as EMA, MACD, and RSI into simplified buy and sell signals.
In practice, Xmaster is usually used when traders want faster signals, while XHMaster is often preferred when traders want smoother confirmation on higher timeframes. Results vary by version, market, and settings, so both tools should be tested on a demo account before live use.
Key Takeaways:
Xmaster Formula Indicator usually gives faster signals and is often preferred for scalping or short intraday setups.
XHMaster Formula Indicator usually gives smoother signals and may fit day trading or swing trading better.
Both indicators combine trend and momentum filters, but performance still depends on the file version, settings, and market conditions.
They do not predict price on their own; combining them with filters such as EMA, RSI (Relative Strength Index), and ATR is still important.
RSI shows overbought readings above 70 and oversold readings below 30, which can help filter entries when price is already stretched.
Traders compare Xmaster and XHMaster because both aim to simplify signal reading, but they do it differently. Xmaster tends to react faster and can suit short-term traders, while XHMaster usually applies more smoothing and may suit traders who prefer fewer signals on higher timeframes.
The better choice depends on your platform, the file version you are using, your timeframe, and how you confirm signals with risk controls and other tools.
Both indicators turn several technical conditions into simple buy and sell markers, but they should not be treated as interchangeable.
In general, Xmaster is the faster, more reactive version, while XHMaster is usually the smoother, more filtered version.
That trade-off matters: faster signals can help with earlier entries, but they can also create more noise when the market is ranging.
Xmaster: Built for speed, with lighter filters. Signals appear quickly, but this also means more false positives.
XHMaster: Built for accuracy, with heavier smoothing. Signals arrive later, but with fewer false alarms.
Xmaster Formula Indicator → Best for Scalping and Intraday:
Works well on M5-M30 charts where traders need fast entries and quick exits.
Limitation: Can struggle in sideways markets and may need extra filters (like EMA or ATR).
XHMaster Formula Indicator → Best for Day and Swing Trading:
Performs better on H1-Daily charts, where traders hold positions for hours or days.
Limitation: Signals can lag, which sometimes means entering late into strong moves.
In short: Choose Xmaster if you want speed. Choose XHMaster if you want accuracy. Many traders even combine them, using Xmaster for early signals and XHMaster as confirmation.
| Feature | Xmaster Formula Indicator | XHMaster Formula Indicator |
|---|---|---|
| Main use | Earlier signal detection on lower timeframes | Smoother confirmation on higher timeframes |
| Typical behaviour | More reactive to short-term price changes | More filtered and slower to update |
| Common timeframe fit | M5 to M30 | H1 to Daily |
| Strengths | Fast visual signals, simple layout, useful for scalping with extra filters | Cleaner signals, fewer flips, better suited to trend-following |
| Main trade-off | More false signals in ranges or noisy sessions | More lag and later entries |
| Best practice | Confirm with EMA, RSI, ATR, and session filters | Confirm with trend structure, volatility context, and risk rules |
| Version caution | Behaviour may vary by file source and settings | Behaviour may vary by file source and settings |
Choose Xmaster when your priority is earlier signals on lower timeframes and you are comfortable adding extra filters.
Choose XHMaster when your priority is cleaner signals and you are willing to accept more lag.
In either case, the result depends on the exact file version, chart timeframe, and market conditions. Treat both as supporting indicators, not standalone trading systems, and confirm signals with trend context, volatility checks, and risk management.
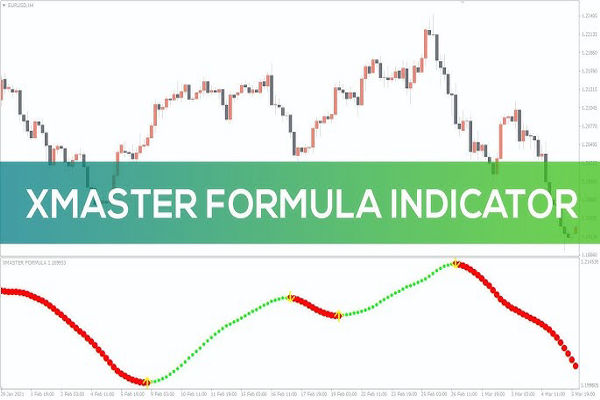
The Xmaster Formula Indicator is a custom forex tool most commonly used on MetaTrader 4 (MT4), although some modified versions also circulate for MT5.
Its purpose is to simplify technical analysis by showing chart-based signals instead of forcing traders to combine several tools manually. That can make it easier for beginners to follow, but the indicator still needs confirmation from price action and risk controls.
Although the exact formula is not always disclosed by developers, most versions of Xmaster combine:
Moving Averages (MA): To detect the overall trend direction.
MACD (Moving Average Convergence Divergence): To measure momentum shifts.
RSI (Relative Strength Index): To filter overbought/oversold zones.
Volatility Envelope: To track when price is stretching too far from its average.
Together, these filters aim to produce arrows that appear when multiple conditions align. For example, if trend and momentum point upward and RSI shows enough strength, a green (buy) arrow will be shown.
On your MT4/MT5 chart, the Xmaster indicator typically displays:
Green arrows below candles = Buy signal.
Red arrows above candles = Sell signal.
A smoother histogram or colored line that shifts with momentum.
This responsiveness makes it good for short-term trades, but the speed can also create false signals in sideways markets.
The XHMaster Formula Indicator is commonly described as a modified version of Xmaster that adds extra filtering or smoothing.
In practice, public versions can behave differently, so traders should judge the exact file they are using rather than assume all XHMaster builds work the same way. Its main appeal is a cleaner signal flow, especially for traders who prefer higher timeframes.
Compared to Xmaster, the XHMaster tends to:
Filter out market noise more effectively in ranging conditions.
Generate fewer but more reliable arrows, especially on higher timeframes.
Lag slightly more, because of the smoothing, but often improves accuracy in trending conditions.
On MT4/MT5, XHMaster also shows green and red arrows, but they appear less frequently. Instead of flipping signals often, it waits until stronger confirmations are in place. This makes it more useful for day traders and swing traders who prefer quality over quantity.
The Xmaster and XHMaster Formula Indicators are not magic buttons, they work by combining several well-known technical tools into a single overlay. Understanding how these components interact will help you use them more effectively, reduce false signals, and improve your trading decisions.
EMAs track the average price over a set number of bars, giving more weight to recent price action.
Traders use EMAs to identify the trend direction. For example, price above a 200 EMA usually indicates an uptrend.
In Xmaster/XHMaster, EMAs help decide when to trigger buy or sell arrows based on trend alignment.
MACD measures momentum by comparing two EMAs and plotting the difference as a histogram.
Positive histogram bars indicate bullish momentum; negative bars indicate bearish momentum.
The indicator uses MACD to confirm trend strength and avoid entering weak moves.
RSI shows overbought (>70) or oversold (
For example, Xmaster may avoid triggering a buy arrow if RSI is already above 70, even if EMA and MACD suggest an uptrend.
Measures momentum and market turning points by comparing the closing price to a recent high/low range.
Often used alongside RSI to confirm that a trend is not exhausted.
Plots dots above or below price to indicate potential reversal points.
Xmaster/XHMaster uses it to refine entries and signal potential stop-loss zones.
Some versions include volatility envelopes to detect price extremes.
Helps prevent signals when the market is stretched or in a temporary spike.
The power of Xmaster and XHMaster comes from combining multiple indicators, each with a different purpose:
Trend (EMA) ensures you only trade with the market direction.
Momentum (MACD & Stochastic) confirms that the trend is strong enough to act on.
Overbought/Oversold Filter (RSI) prevents entries near extremes where reversals are likely.
Reversal/Safety (Parabolic SAR & Bollinger Bands) helps reduce risk and refine stop-loss placement.
Sideways/Ranging Markets: Trend is weak or non-existent; EMA crosses, MACD, and momentum indicators may flip back and forth, creating false signals.
Sudden Volatility Spikes: News events can override indicator predictions, causing arrows to appear after a sharp move.
Always combine these indicators with contextual filters like multi-timeframe trend analysis, ATR-based stop adjustments, or volatility filters to improve accuracy.

Open your MT4 platform.
Click File → Open Data Folder.
Navigate to MQL4 → Indicators.
Copy the Xmaster/XHMaster .ex4 or .mq4 file into this folder.
Close and restart MT4.
Open Navigator (Ctrl+N) → Indicators → Drag Xmaster/XHMaster onto a chart.
Adjust inputs and parameters as needed.
After installation, always check the Experts/Journal tab for errors. If there’s an error, the file may be in the wrong folder or incompatible with your MT4 build.
Open your MT5 platform.
Click File → Open Data Folder.
Go to MQL5 → Indicators.
Copy the .ex5 or .mq5 file into this folder.
Restart MT5.
In Navigator, locate the indicator, drag it to your desired chart.
Customize settings according to your strategy.
MT4 and MT5 have different file structures. MT4 files do not work on MT5 and vice versa.
Once the indicator is loaded, you can adjust key parameters:
| Parameter | Purpose | Practical starting point |
|---|---|---|
| Sensitivity / Signal Strength | Controls how easily arrows appear | Start at default and adjust one step at a time |
| Smoothing / Periods | Reduces noise but adds lag | Lower for scalping, moderate for day trading, higher only if your version remains usable |
| Arrow Size & Color | Improves chart readability | Use clear contrast and keep arrows visible without clutter |
| Alert Options | Triggers popup, email, or push alerts | Enable only after you confirm the signal logic on your chart |
| Other Filters | Adds version-specific EMA, RSI, ATR, or volatility rules | Match the filter to the market and timeframe you trade |
Both are primarily designed for MetaTrader 4 (MT4), though some modified versions exist for MT5.
XHMaster is a modern variant with customizable sensitivity and clearer visuals; core logic remains similar to Xmaster.
Neither is universally superior. Xmaster offers faster signals but more noise, while XHMaster provides cleaner but sometimes slower entries.
Xmaster works best on M5 to M30 charts, perfect for scalping and fast intraday trades.
In indicator settings, enable popup, email, or push notifications. Alerts trigger whenever a new buy or sell arrow appears.
Not necessarily. Repaint behaviour depends on the exact version and how the indicator calculates signals. If you plan to use any Xmaster or XHMaster file, test it in the Strategy Tester or on a live chart replay before relying on historical arrows.
Many versions circulate online as free downloads, and some vendors package modified versions as paid products. Before using any file, verify the source, compatibility, and settings.
They can be applied to any chart in MT4 or MT5 that accepts the file, but performance can vary widely by market. Forex pairs are the most common use case; indices, commodities, and crypto should be tested separately before live use.
Yes, most MT4/MT5 custom indicators apply to any chart. But test thoroughly, crypto volatility is different from Forex.
Accuracy depends on market conditions, timeframe, and filters used. XHMaster is generally more reliable in trending markets, while Xmaster can produce more false signals in sideways conditions.
Add filters like RSI or time-of-day, avoid trading in ranges, or wait for multi-timeframe alignment.
If you prefer quick, frequent signals then use Xmaster. If you want fewer, steadier setups then use XHMaster.
Yes, the visual arrows can make them easier for beginners to follow. Still, beginners should start on a demo account, learn basic market structure, and use clear risk limits before trading live.
They are mainly popular among retail traders. Professionals tend to rely on broader quantitative or price action models.
Yes, and you should. Common pairings:
Supertrend for trend filter.
RSI or MACD for momentum.
EMA crossovers for confirmation.
Past performance is not indicative of future results; always use proper risk management and demo test any strategy.
Xmaster and XHMaster can be useful signal-support tools, but they suit different trading styles. Xmaster is generally better when speed matters and you are focused on scalping or short intraday setups. XHMaster is usually better when you want smoother confirmation for day trading or swing trading.
Neither indicator should be used as a complete system. Performance depends on the exact version, the timeframe, the market, and the filters around it. Confirm signals with price structure, volatility, and a higher-timeframe view before taking a trade.
Installing them on MT4 or MT5 is simple. Place the correct file type in the Indicators folder, restart your platform, and adjust key settings like sensitivity, arrow size, and smoothing. Test all settings on a demo account before trading live.
Test every setup on a demo account first, then combine the indicator with risk management, stop-loss placement, and position sizing. That approach is more realistic, more defensible, and more useful than treating any arrow-based tool as a shortcut to profits.
Xmaster = speed, XHMaster = accuracy.
Always confirm signals with trend and momentum filters.
Demo test every setup before using real money.
Adjust settings to match your trading style.
Trading forex involves significant risk, and past performance does not guarantee future results. The Xmaster and XHMaster indicators are tools to assist in trading decisions, but they do not guarantee profits. Always use proper risk management and test any strategy on a demo account before trading with real money.