Published on: 2025-12-17
Updated on: 2025-12-17
The XHMaster Formula Indicator is a custom, arrow-based trend-and-momentum tool used primarily by forex traders on MT4 and MT5, with a widely shared TradingView version as well.
It typically combines signals from common indicators, such as moving averages, MACD, RSI, and Stochastics, and translates them into simple visual cues, including colored lines and buy/sell arrows.
One thing to note: the exact calculation is proprietary and is not publicly disclosed, so you should judge it by behaviour on live charts and testing, not by marketing claims.

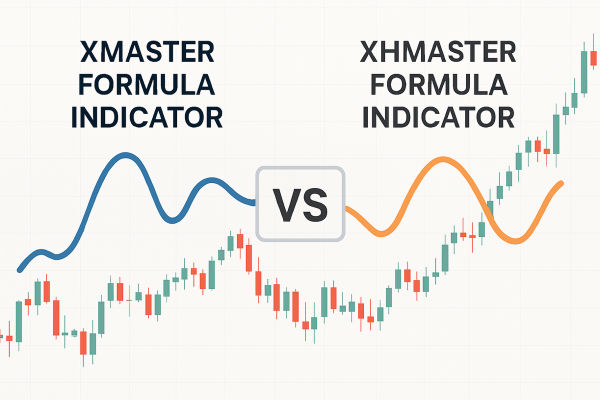
Most traders use the names interchangeably, but draw a line between the original "Xmaster" and the "XHMaster" variant.
Xmaster is the simpler base version, while XHMaster is the more flexible variant, offering additional settings and wider platform support.
Xmaster as MT4-first, with XHMaster supporting MT4 and MT5 in newer versions.
You do not need to argue about labels. What matters is the version you are using, because performance, repaint behaviour, and settings can vary between builds.

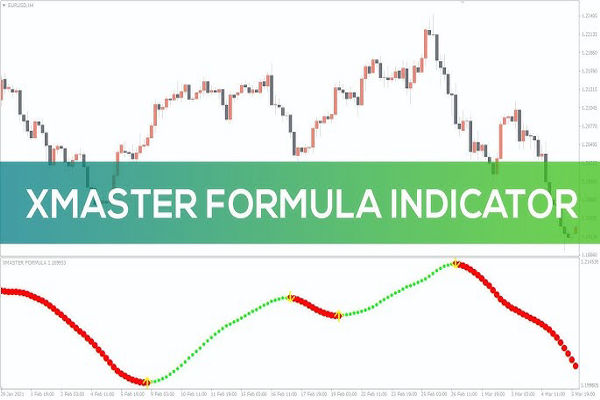
Most versions show some mix of:
A line or oscillator that flips green in bullish conditions and red in bearish conditions.
Arrows (often green for buy and red for sell) to highlight potential entry points or turning points.
Optional alerts (sound, email, or push, depending on the platform) enable you to avoid continuously monitoring the chart.
It is not "predicting" the future; it is flagging when the balance between buyers and sellers appears to have shifted, then leaving the trader to confirm with structure and context.
Moving averages and MACD are the core building blocks.
RSI, Stochastic, Parabolic SAR, and sometimes Bollinger Bands are included, depending on the version.
For example, a "Standard" mode built around a difference between short and long EMAs (10 and 38), normalised onto a 0–100 scale.
That is why this tool feels smooth in trends. Under the hood, it behaves like a trend filter plus momentum confirmation, packaged into a clean signal.
Many users describe XHMaster as "non-repainting," meaning signals don't shift after they appear. However, repainting behaviour can vary by version, so it's essential to backtest and forward-test before relying on it.
You do not need complex tools. Do this:
Open a chart in MT4/MT5 and add XHMaster.
Use Strategy Tester visual mode.
Watch whether arrows appear only after the candle closes, and whether they remain fixed when you step forward candle by candle.
If a tool prints pretty arrows mid-candle and then removes them later, it can look amazing in hindsight and still be useless in live trading.

In 2026, many traders face a common issue: an overload of screens, excessive information, and numerous misleading "setups" each day. XHMaster's formula indicator value is that it forces a simple workflow:
Identify trend direction.
Wait for a clean signal.
Confirm with the price structure.
Execute with defined risk.
It's important to note that accuracy tends to improve during practical intraday windows, such as M30 to H4. Additionally, the signal frequency on H1 often falls within the range of one to two signals per day. This limited frequency helps prevent compulsive trading.
A simple rule that keeps you out of trouble:
Only consider buying arrows when the indicator is in a bullish (green) regime on the higher timeframe.
Only consider selling arrows when the indicator is in a bearish (red) regime on the higher timeframe.
This one change cuts most of the "chop" losses that come from taking every arrow.
Before you enter, ask:
Is price breaking above a recent swing high for a buy, or below a swing low for a sell?
Is there a clear stop level that is not random?
Is the next target a real area (prior high/low, range edge), or is it wishful thinking?
We suggest using price structure and additional filters to confirm signals, since XHMaster is a trend-following tool that performs best when it aligns with the higher-timeframe trend.
For most retail traders, this is enough:
Risk 0.5% to 1% per trade.
Put the stop beyond the last swing point.
Take partial profit at 1R if volatility is high, then trail the rest.
| Setting | What it changes | Pro tip |
|---|---|---|
| Signal frequency / sensitivity | More or fewer arrows | Fewer signals is usually better in choppy markets. |
| Alerts (sound/email) | Notifications | Use alerts to avoid staring at charts, but only trade after confirmation. |
| Chart theme / visuals | How it looks | Keep it simple so you can spot flips quickly. |
Most versions include controls for themes and alerts, with some allowing adjustments for sensitivity or signal frequency.
Listed is a clean, original framework you can publish without pretending you ran a secret backtest. It helps readers grade signals.
Give each signal one point for each condition:
The indicator on the higher timeframes (such as H4 or D1) aligns with the signal.
Price breaks a recent swing level in the signal direction.
The candle closes beyond a key moving average (such as 20 EMA).
You are trading during a liquid session for your pair (London or New York for most majors).
The risk-to-reward ratio to the next structure target is at least 1.5R.
How to use it:
Score 4–5: trade normally with your standard risk.
Score 3: reduce size or tighten rules.
Score 0–2: ignore it, because it is probably noise.
A visual signal must be confirmed by price organisation and market circumstances, rather than accepted unthinkingly.
Taking every arrow in a range. Lower the sensitivity or adjust the timeframe to a shorter duration.
Trading before candle close. That is how repaint rumours start. Test whether your version confirms on close.
Ignoring version risk. Different downloads can behave differently. Even pro guides warn that repaint behaviour can vary by build.
Yes, because it simplifies trend reading into clear visuals, but beginners still need confirmation and risk rules.
Many versions are available for MT4 and MT5, and a TradingView script is also widely shared. Availability depends on the exact build and source.
A practical sweet spot is usually M30 to H4 for many traders, because it reduces noise while still offering regular setups.
In conclusion, the XHMaster Formula Indicator is popular because it solves a real trading problem: most people do not need more indicators; they need fewer decisions. It simplifies a complicated chart, highlighting trends and crucial moments to focus on.
In 2026, the most effective way to use it is straightforward yet efficient. First, verify whether your version repaints. Then trade in the direction of the higher-timeframe trend, validate entries with a clear price structure, and stick to strict risk limits.
Do that, and XHMaster becomes a useful part of a professional routine. Ignore that, and it becomes just another arrow indicator that looks great in hindsight and costs money in real time.
Disclaimer: This material is for general information purposes only and is not intended as (and should not be considered to be) financial, investment or other advice on which reliance should be placed. No opinion given in the material constitutes a recommendation by EBC or the author that any particular investment, security, transaction or investment strategy is suitable for any specific person.