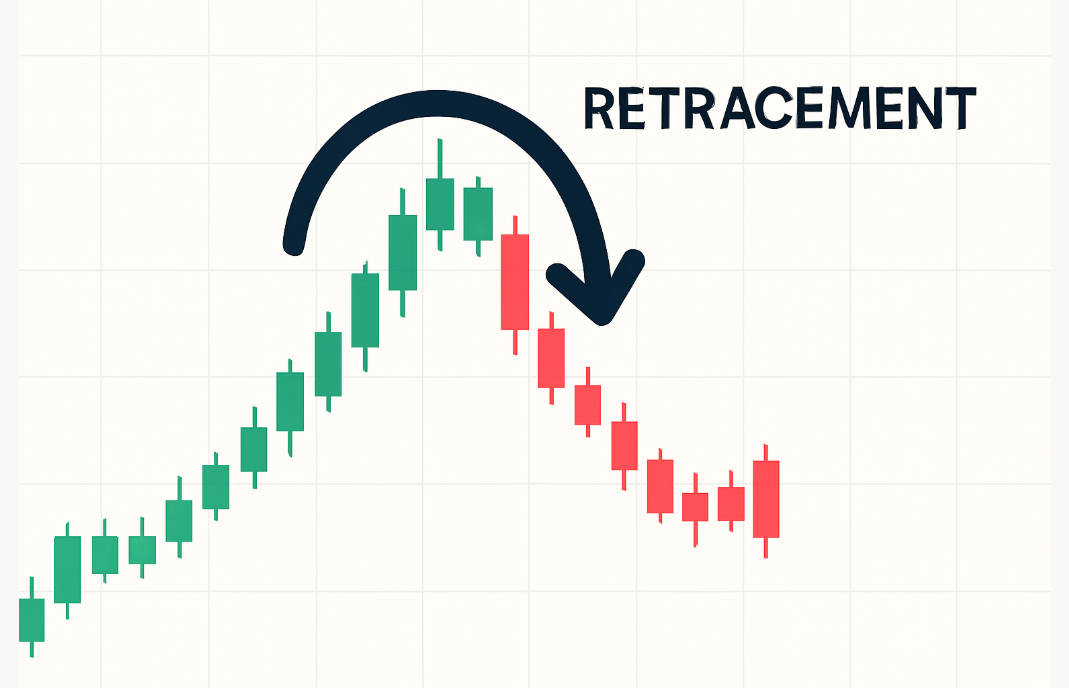
Retracements occur because markets rarely move in a straight line; short-term pullbacks happen as traders take profits, react to news, or wait for better entry points.
Understanding these temporary corrections is essential for effective trading.
Below, you will explore the causes of retracements, the tools used to identify them, practical trading strategies, and common pitfalls to avoid.
How to Differentiate Retracements from Reversals
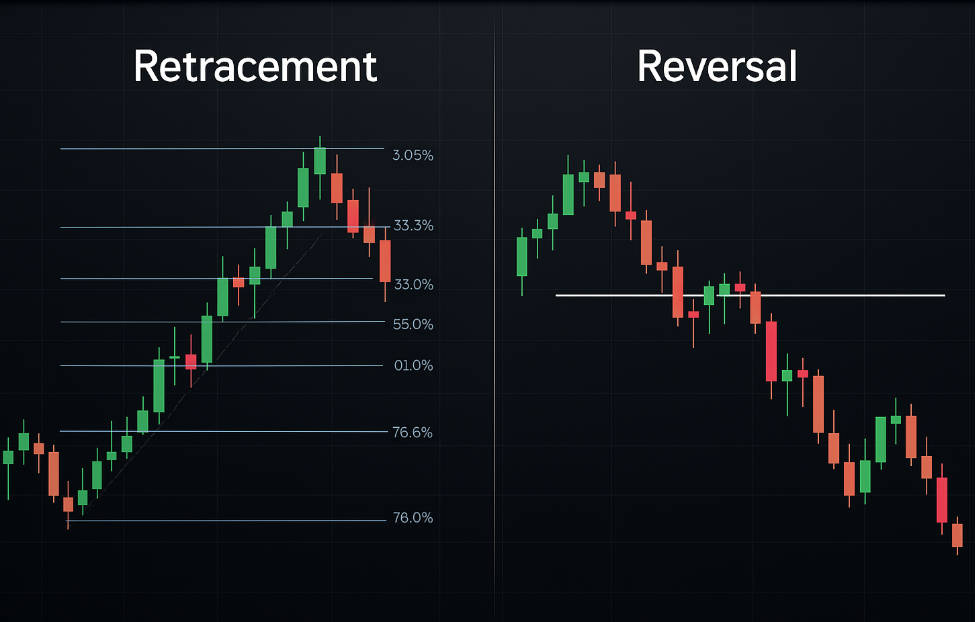
Financial markets rarely move in straight lines. Even in strong uptrends or downtrends, prices pull back due to profit taking, short-term news, or changes in sentiment. These pullbacks are retracements.
Reversals, on the other hand, indicate that the prior trend has ended. For example, a share price climbing steadily may fall back by 38% before rising again — this is a retracement. But if it breaks major support levels and continues falling with momentum, it is more likely a reversal.
The psychology behind retracements is rooted in investor behaviour. Traders lock in profits, cautious buyers wait for better entry points, and sellers temporarily outweigh buyers. These forces cause short-lived corrections rather than permanent changes in direction.
Methods for Identifying Retracement Levels in Price Trends
Identifying retracements begins with recognising the main trend. A retracement remains valid only if the primary uptrend or downtrend is intact. Traders often look for:
Price pullbacks that respect previous support or resistance levels
Temporary declines that do not breach the overall trend structure
Corrections that occur within logical boundaries, usually on higher timeframes
Choosing swing highs and lows is a key step in measuring retracements. By anchoring indicators such as Fibonacci levels to these points, traders can estimate where the price may pause before resuming the trend.
Popular Tools and Indicators Used to Measure Retracements
Several tools are widely used to identify retracement zones:
Levels such as 23.6%, 38.2%, 50%, 61.8%, and 78.6% highlight potential areas where price may stabilise before resuming.
2) Support and Resistance:
Historical price levels often act as natural retracement points.
3) Trendlines and Channels:
Retracements frequently respect drawn trendlines or the edges of price channels.
4) Moving Averages:
Common averages (50-day, 200-day) serve as dynamic support and resistance.
5) Oscillators:
Indicators like RSI and MACD help confirm whether a retracement is a healthy pause or a sign of weakening momentum.
6) Volume:
Declining volume during a pullback often confirms a retracement rather than a reversal.
Using these tools together provides stronger confirmation than relying on one method alone.
Trading Approaches Built Around Retracement Opportunities
Retracements are used as part of both entry and exit strategies.
Entry Techniques: Traders may buy on a bounce from a Fibonacci or support level, or wait for a breakout after the retracement.
Risk Management: Stop-loss orders are often placed just beyond the invalidation level of a retracement zone. This protects against larger-than-expected moves.
Profit-Taking: Some traders exit partially at major retracement levels or trail stops behind new swing highs and lows.
Combination Approaches: Retracements are more effective when combined with candlestick patterns, trend confirmation, or momentum signals.
Avoiding false retracements requires discipline. Quick pullbacks or shallow corrections can mislead traders into entering prematurely. Waiting for confirmation improves reliability.
Evidence from Market Studies on Retracement Effectiveness
Studies on Fibonacci retracements suggest mixed results. Some research indicates that retracement levels, especially 38.2% and 61.8%, are statistically significant in certain asset classes.
For example, energy stocks have shown retracement patterns that outperform a simple buy-and-hold strategy.
However, many academic reviews conclude that retracement levels are not inherently predictive. Their effectiveness depends heavily on market conditions, timeframe, and whether they are combined with other indicators.
In practice, retracements often work because many traders watch the same levels. This creates a self-fulfilling element, but not a guarantee.
Practical Guidance for Applying Retracements in Real Trading
When using retracements, practical considerations matter as much as theory.
Timeframes: Longer timeframes tend to produce stronger retracement signals than intraday charts.
Charting Platforms: Most trading software allows quick drawing of Fibonacci and trendline retracements.
Confluence: A retracement level aligned with support, moving averages, and momentum signals is stronger than a level on its own.
Psychological Discipline: Traders must wait for retracements to complete and resist the urge to chase price.
Case Studies: In equity markets, retracements often provide entries during broader bull runs. In forex, they are common within trending currency pairs like EUR/USD.
Risks, Limitations, and Mistakes to Avoid with Retracements
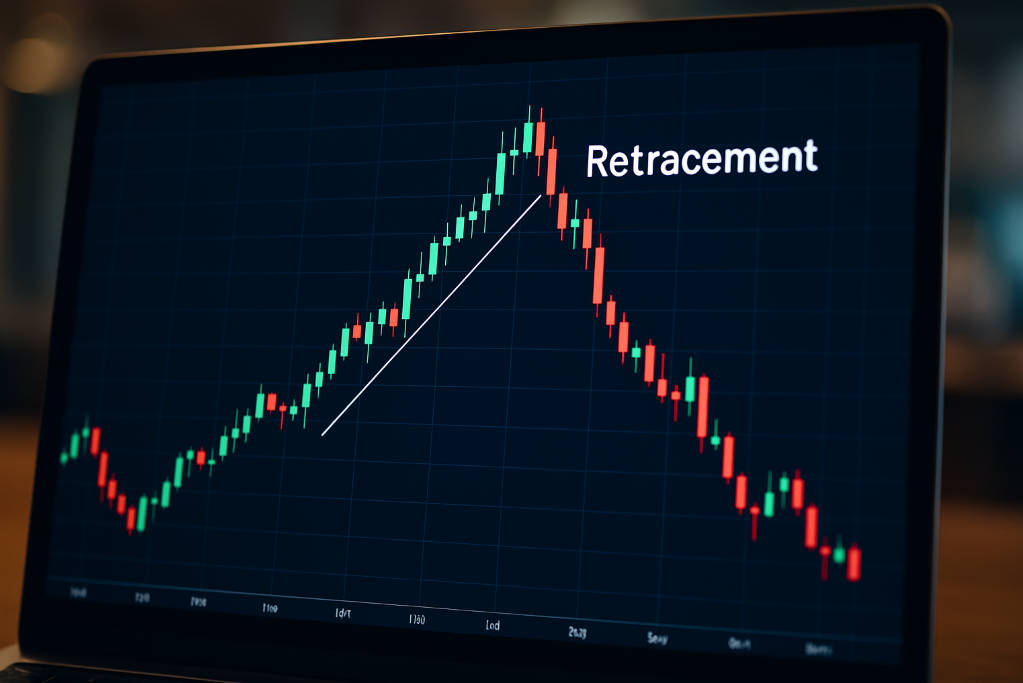
While retracements are widely used, they are not foolproof. Common pitfalls include:
Relying solely on Fibonacci or static levels without confirmation
Mistaking deep retracements for reversals, leading to poor trade management
Ignoring broader fundamentals that could override technical signals
Overconfidence, assuming retracements always resume the prior trend
Traders should always use risk management and avoid overexposure based on a single retracement signal.
Conclusion: Best Practices for Incorporating Retracements into Strategy
Retracements remain a cornerstone of technical analysis, offering traders a structured way to spot opportunities. The key lies in combining retracements with broader trend analysis, multiple indicators, and disciplined execution.
A best-practice checklist includes:
Confirm the trend before looking for retracements
Use multiple tools for validation
Set clear stop-loss and exit strategies
Remain aware of fundamental factors alongside technicals
When applied carefully, retracements can be powerful tools in trading and investing strategies.
Frequently Asked Questions:
Q1: What is the difference between a retracement and a reversal?
A retracement is a temporary pause within an ongoing trend, while a reversal indicates a complete change of direction in the market.
Q2: Which Fibonacci retracement levels are most widely used by traders?
The most common levels are 38.2%, 50%, and 61.8%. Many traders also watch 23.6% for shallow corrections and 78.6% for deeper pullbacks.
Q3: Can retracement strategies deliver consistent profitability?
Results vary. Retracement levels can be effective when combined with trend confirmation and risk management, but they are not consistently predictive on their own.
Q4: How can traders reduce the risk of mistaking a reversal for a retracement?
Traders should confirm with multiple indicators, monitor volume and momentum, and set invalidation points. If price moves significantly beyond typical retracement levels, the likelihood of a reversal increases.
Disclaimer: This material is for general information purposes only and is not intended as (and should not be considered to be) financial, investment or other advice on which reliance should be placed. No opinion given in the material constitutes a recommendation by EBC or the author that any particular investment, security, transaction or investment strategy is suitable for any specific person.


