Published on: 2026-09-02
A trading strategy can win nine trades in ten and still lose money, because profitability depends on the size of wins and losses, not on how often they occur. Take nine winners of $50 and one loser of $500: the wins collect $450, the loss removes $500, and a 90% win rate leaves the account $50 lighter. Win rate measures how often a strategy is right; expectancy shows whether those wins outweigh the losses.
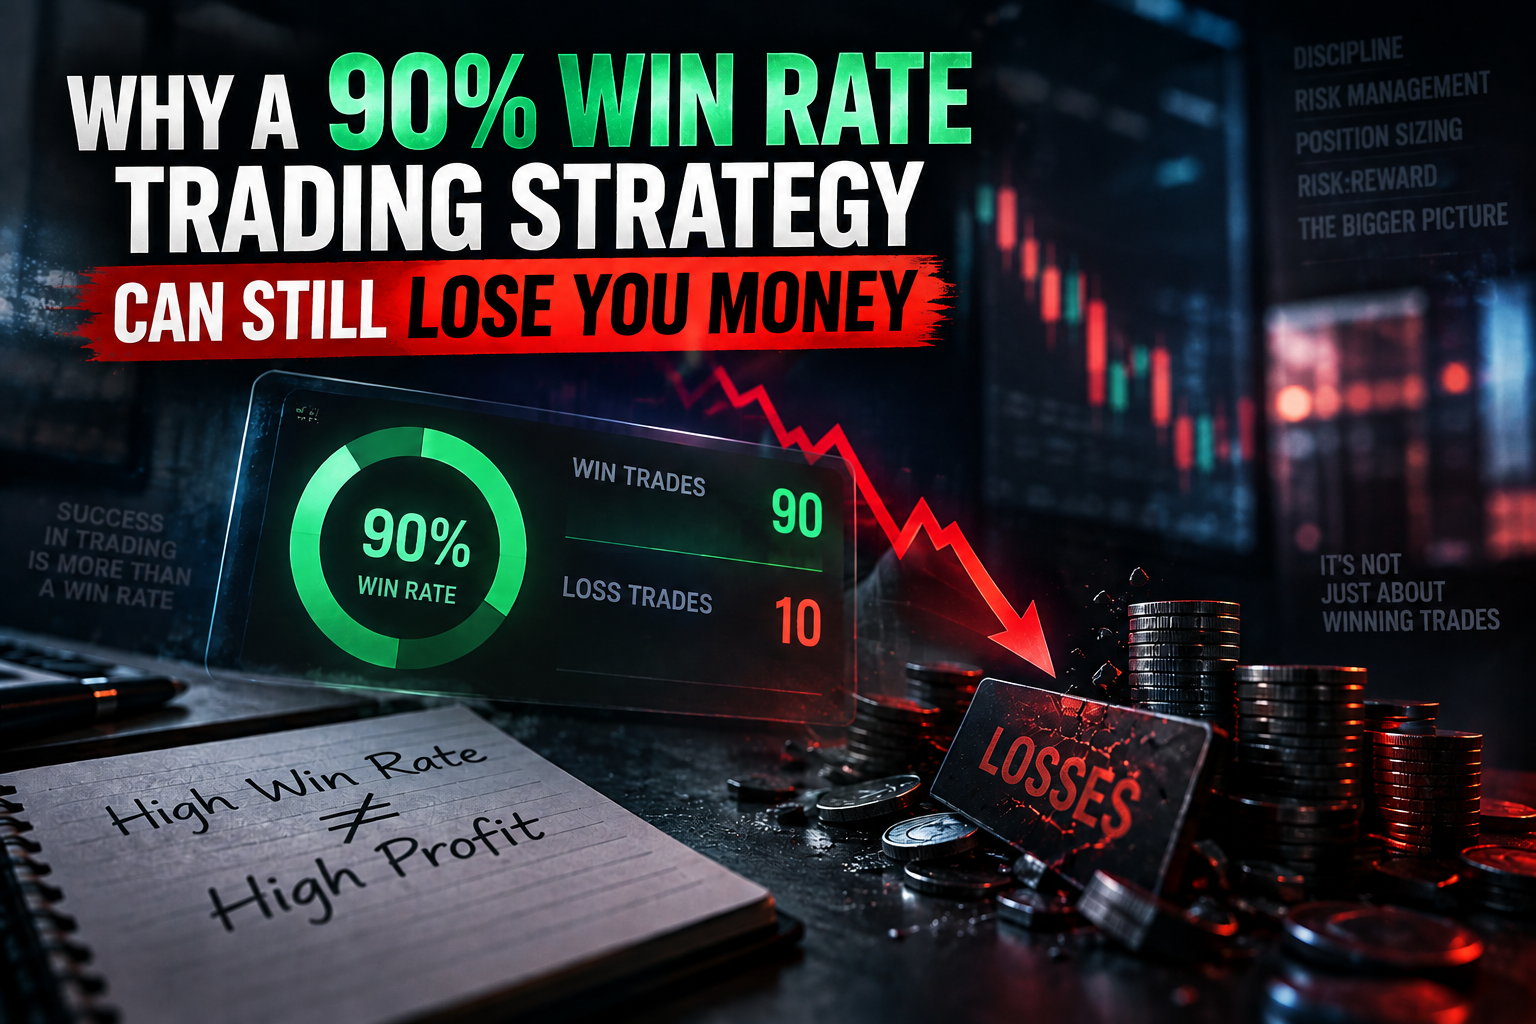
A 90% win rate does not guarantee profit: an average loss above nine times the average win puts the strategy underwater before costs.
Expectancy, calculated as (win rate × average win) - (loss rate × average loss), shows whether a strategy makes or loses money on average.
A high win rate can come from taking small profits quickly while allowing larger losses, improving the percentage without necessarily improving the strategy.
Raising your win rate helps when it comes from better trade selection, filtering and execution, not simply from shrinking profit targets or widening stops.
Every strategy’s long-run result can be understood through its expectancy: the average amount it makes or loses per trade.
Expectancy = (win rate × average win) - (loss rate × average loss)
Run it over 100 trades. Ninety winners at $50 collect $4,500; ten losers at $500 give back $5,000. The strategy is right 90% of the time and down $500, an expectancy of:
(0.90 × $50) - (0.10 × $500) = -$5 per trade
The break-even line falls out of the same formula. At a 90% win rate, nine winners fund every loser, so the strategy has positive expectancy only while the average loss stays below nine times the average win, before trading costs.
Cross that line and the most impressive hit rate in the room is quietly losing money.
A high win rate can sometimes come from changing how quickly you take profits or how much room you give losses.
All else equal, a nearer profit target is easier to reach than a distant one. Moving the target closer can therefore increase the hit rate while shrinking the average winner. The headline percentage improves, but expectancy may not.
Widening a stop can keep some trades open through small losses, which may lift the observed win rate. But the remaining losing trades can then run farther, increasing their potential size.
Trading without a defined loss limit makes that asymmetry harder to control.
0DTE credit spreads provide a clear example. An out-of-the-money credit spread can have an increased probability of expiring worthless, but the maximum profit is limited to the premium collected while the maximum loss is the spread width minus that premium. A high probability of success can therefore coexist with a much larger potential loss.
Spreads, commissions and slippage reduce net returns on every trade. Their effect matters most when the gross profit per trade is small, or the strategy trades frequently. Tighten the earlier strategy’s average loss to $450, and it breaks even exactly:
(0.90 × $50) - (0.10 × $450) = $0
Now add a $5 average round-trip cost per trade. Expectancy falls to -$5 per trade, or $500 lost across 100 trades.
A $5 cost consumes 10% of every $50 gross winner before considering its effect on losing trades.
No, and two strategies over the same 100 trades show why.
Strategy A
90% win rate
Average win: $50
Average loss: $450
Strategy A breaks even before costs:
(0.90 × $50) - (0.10 × $450) = $0
Strategy B
55% win rate
Average win: $100
Average loss: $50
Strategy B earns:
(0.55 × $100) - (0.45 × $50) = $32.50 per trade
It is wrong nearly half the time and still finishes $3,250 ahead over 100 trades.
There is no universally good win rate and no single correct risk-reward, only a break-even line that moves with the size of wins and losses.
The table shows the largest average loss a strategy can carry, per $1 of average win, before it stops making money.
Win rate |
Break-even average loss per $1 of average win |
40% |
$0.67 |
50% |
$1.00 |
60% |
$1.50 |
75% |
$3.00 |
90% |
$9.00 |
A 90% win rate makes an excellent screenshot; the table is what it answers to.
A rising win rate is worth having when it comes from taking better trades, not from redrawing targets and stops around the same ones.
Define exactly what a valid setup looks like, then avoid entries that do not meet those conditions. That keeps the strategy’s results tied to the rules being evaluated instead of mixing planned and discretionary trades.
If historical testing suggests that a particular filter consistently removes weaker trades, the next step is to see whether that improvement survives on fresh data.
Performance can change with market conditions. Break results down by session, volatility, trend condition or instrument and look for environments where the strategy has historically performed better or worse.
The goal is not to keep adding filters until the backtest looks perfect. Any condition identified this way still needs to work on fresh data before you can treat it as a genuine improvement.
Execution can change the results of an otherwise unchanged strategy. Review whether entries regularly deviate from the planned trigger, whether trades are chased after the intended entry has passed, or whether discretionary exits change the payoff that was originally tested.
Improving consistency makes the measured win rate more representative of the strategy itself. Shrinking the target until more trades reach it is the small-target trap again.
Keep changing enough rules against the same historical sample and the backtest can begin fitting that sample rather than the underlying strategy.
A stronger test freezes the new rules and checks whether the improvement survives out-of-sample or forward data.
Keep the change only if the higher win rate is accompanied by expectancy and net performance that also hold up on fresh data.
For understanding whether a high win rate is actually profitable, four numbers provide the minimum useful picture.
Metric |
What it tells you |
Win rate |
How often trades finish profitable |
Average win |
What a typical winner pays |
Average loss |
What a typical loser costs |
Expectancy |
What the strategy earns or loses per trade, on average |
Read them together, and after costs.
A rising win rate is good news while the average win holds and the average loss stays contained. If the rate climbed because profits shrank or losses grew, the strategy deteriorated behind an improving headline.
It can be, but the number alone proves little. Ask what the average loss looks like beside the average win. At 90%, an average loss above nine times the average win erases the edge entirely, and trading costs push that threshold even lower.
No fixed minimum exists because the break-even point depends on the size of wins and losses. A strategy whose winners average twice its losers breaks even near a 33% win rate. One whose winners are half the size of its losers needs about 67%.
Yes. A nearer target is easier to reach, so the percentage of winning trades may rise. But the average winner shrinks, costs take a larger share of each smaller win, and overall expectancy can fall even as the win rate climbs.
A strategy can win 90% of the time and still lose money because win rate counts outcomes while expectancy weighs them, and nine small wins cannot carry one oversized loss. Chasing the percentage alone can buy that improvement with smaller targets, wider stops or larger tail losses, leaving expectancy worse despite a better-looking scoreboard. Judge a strategy by what a hundred trades leave in the account, not by how many of them felt like winning.