Published on: 2026-03-24
V pattern trading refers to a powerful technical analysis chart formation that identifies sharp trend reversals in financial markets. It signals a swift and sudden change in price direction following a rapid decline or advance. Traders watch for this distinctive shape because it can offer clear entry and exit signals when confirmed with volume and other indicators.
V-pattern trading is a chart pattern that signals abrupt trend reversals.
It consists of a steep price drop followed by a sharp rebound that together resemble the letter V.
Traders use it to identify potential long and short trading opportunities.
Confirmation often requires support from volume and trendline breakouts.
It can be applied across multiple asset classes and timeframes.
V-pattern trading is a technical analysis technique used by traders to identify rapid reversals in market trends. The pattern appears on price charts when an asset’s price falls sharply, reaches a low, and then reverses direction just as rapidly. This creates a shape resembling the letter V. Traders interpret this as a signal that selling pressure has exhausted and that buying interest is strong enough to push prices higher.
Technically, the pattern consists of two key legs: the sharp downward move and the equally steep comeback. The bottom of the V marks where selling momentum slows, and buyers begin to assert control. Identifying this pattern early can help traders capture strong momentum trades without waiting for lengthy consolidations or complex chart developments.
V patterns reflect rapid shifts in market sentiment and trader psychology. At the initial stage, a sudden surge in selling pressure pushes prices sharply lower. This can be triggered by unexpected news, economic releases, or panic selling as traders seek to cut losses. As prices reach oversold conditions, opportunistic buyers or value seekers step in, triggering a swift reversal. If buying demand overwhelms supply, the price rebounds rapidly, completing the V shape.
Traders often use volume as a confirmation tool because it suggests that the reversal is backed by strong participation rather than a short-lived bounce.
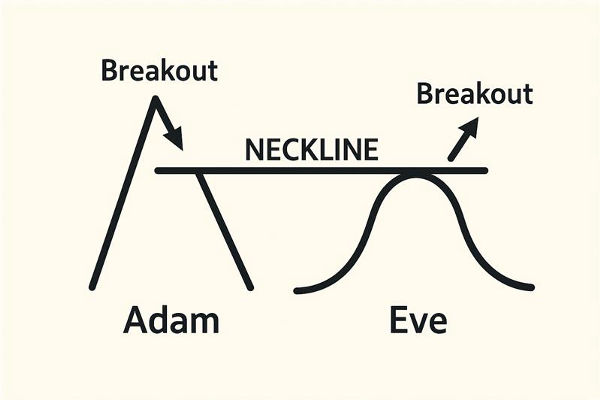
There are two primary types of V patterns used by traders:
This occurs when prices fall sharply and rebound equally quickly. It is interpreted as a bullish reversal signal and is typically followed by continued upward momentum after the breakout.

An inverted V pattern forms when prices spike suddenly higher and then drop sharply. This can signal a bearish reversal, with an uptrend ending and downward momentum beginning. Traders often take short positions when the price breaks below the pattern’s support level.

Successful V pattern trading requires a disciplined approach. Below are common strategies that traders use to capitalise on this formation.
This conservative technique involves waiting for the price to break above the resistance level that formed before the decline. Once the price closes above this level with supportive volume, traders initiate a long position. A stop-loss is typically placed beneath the pivot low to manage risk.
After the breakout, markets often pull back to retest the breakout level. Traders may enter on confirmation of support at the retest, allowing for tighter stops and potentially better risk-to-reward ratios.
Experienced traders may enter near the pivot once early signs of reversal, such as bullish candlestick patterns or momentum indicator divergences, appear. This technique carries a higher risk and requires strict risk management.
In inverted V patterns, traders watch for a breakdown below support. Once breached, a short position can be taken with stops above the recent swing high. This approach allows traders to capture downward momentum.
One key advantage of the V pattern is that it can appear across multiple timeframes, from intraday to weekly. Traders must adjust their strategies based on the pattern's timeframe. Shorter timeframes may offer quick intraday opportunities, while longer timeframes may reflect broader market reversals. Confirming the pattern across multiple timeframes can increase confidence in the trade.
V-pattern trading works best when combined with other technical analysis tools. Common indicators used alongside V pattern signals include:
Moving Averages to identify trend direction.
The Relative Strength Index (RSI) is used to detect overbought or oversold conditions.
MACD (Moving Average Convergence Divergence) for momentum confirmation.
These complementary tools help traders filter false signals and refine entry and exit points.
Even though V patterns can offer strong signals, traders must be cautious of:
False Reversals, where price briefly rebounds, then continues in the original direction.
Low-volume breakouts may lack the strength to sustain the move.
Late entries can reduce profit potential and worsen risk profiles.
Avoiding these pitfalls requires careful chart analysis and disciplined trade management.
V-pattern trading involves identifying sharp price reversals that form a V shape on charts. It helps traders capture quick trend changes and potentially enter profitable positions early.
Yes, V patterns can occur in stocks, commodities and indices. They reflect psychological shifts in sentiment and are not limited to one market.
Strong volume on the rebound leg and a clear breakout above resistance levels enhance the reliability of V patterns.
V patterns are most effective for short to medium-term traders seeking to capture fast trend reversals. Long-term investors may use them to time entries, but they should combine them with fundamental analysis.
Traders commonly set stop losses under the pivot point and scale positions to limit downside risk. Combining pattern signals with indicators helps manage risk effectively.
V pattern trading is a powerful technical analysis tool that helps traders identify and act on rapid trend reversals. When combined with volume confirmation and complementary indicators, it can offer clear and structured trading opportunities.
Traders should apply disciplined risk management and validate pattern signals across timeframes to improve their success in dynamic markets. With practice and careful analysis, V pattern trading can be a valuable addition to a trader’s strategy toolkit.
Disclaimer: This material is for general information purposes only and is not intended as (and should not be considered to be) financial, investment or other advice on which reliance should be placed. No opinion given in the material constitutes a recommendation by EBC or the author that any particular investment, security, transaction or investment strategy is suitable for any specific person.