Published on: 2026-02-20
Updated on: 2026-02-20
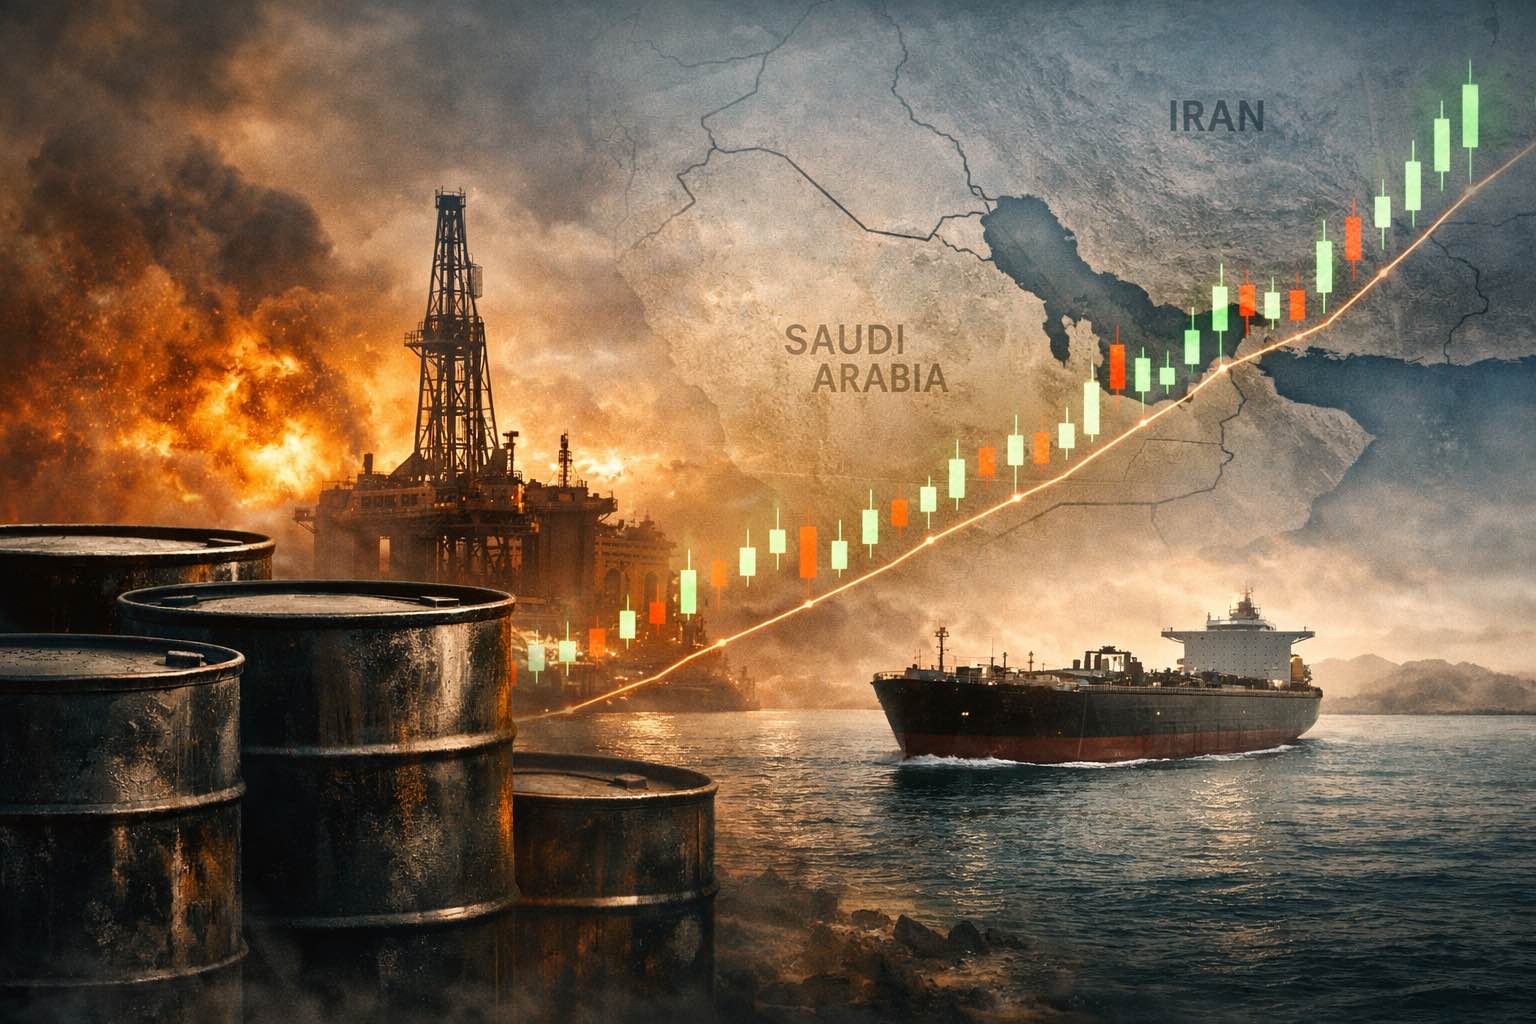
Crude oil markets have redefined the upcoming two weeks as an event window rather than a forecast period. Following volatility and drawdowns in January, West Texas Intermediate (WTI) has returned to the mid-$60s, surpassing the late-month resistance that previously limited rallies. This movement reflects not only supply dynamics but also the increased probability that policy and military developments could prompt the market to price in a short-term, acute supply shock.
The catalyst is a 10 to 15-day deadline associated with U.S.-Iran negotiations, accompanied by a visible military buildup and an expanding sanctions regime. As the timeline shortens, the risk premium transitions from a theoretical concept to a tangible factor, manifesting in prompt contracts, the Brent-WTI spread, and increased intraday volatility that penalizes inadequate risk management.
Market Metric |
Latest Reading |
Why It Matters For Traders |
| WTI Front-Month (Feb 20) | $66.61 | Break above the late-January cap near $66.50 turns prior resistance into a decision point for trend continuation. |
| WTI 1-Month Change (Jan 20 to Feb 20) | +$6.27 (+10.39%) | A double-digit move in four weeks raises stop distance requirements and increases the odds of mean-reversion traps. |
| WTI 52-Week Range | $54.98 to $78.40 | The market is still trading inside last year’s band, which keeps $70 and $78 as magnet levels if risk escalates. |
| Brent (Feb 20) | $71.86 | Brent carries the seaborne geopolitics premium, and it is the cleaner expression of Middle East shipping risk. |
| Brent-WTI Spread (Using Feb 20 Prices) | $5.25 | A widening spread signals global risk premia more than U.S. domestic tightness, often favoring Brent longs over WTI longs. |
| U.S. Commercial Crude Inventories (Week Ending Feb 13) | 419.8M bbl (−9.0M w/w) | A large draw tightens the prompt balance and amplifies breakout moves when headlines hit. |
| U.S. Refinery Utilization (Week Ending Feb 13) | 91.0% | Strong runs pull crude through the system and can steepen backwardation when products hold firm. |
| Strait Of Hormuz Flow | ~20M b/d (≈20% of global liquids consumption) | This is the choke point. Even partial disruption forces a discontinuous repricing. |
| Hormuz Bypass Pipeline Capacity | ~2.6M b/d | Limited bypass capacity means the “workaround” is small relative to the exposure. |
| OPEC+ Policy (Feb–Mar 2026) | Planned increments paused; 1.65M b/d return remains conditional | A cautious stance reduces downside follow-through when geopolitical bids fade. |
| WTI Derivatives Liquidity | >1M contracts/day; ~4M open interest | Deep liquidity enables tactical hedging, but it also means positioning can unwind fast when the narrative flips. |
A compressed deadline significantly alters trader behavior. Rather than pricing a gradual negotiation, the market adopts a binary outlook: either de-escalation with a reduction in risk premium, or escalation with increased gap risk. This dynamic encourages the use of instruments and structures that define risk in advance and concentrate liquidity at the front end of the curve, where headline impacts are most pronounced.

The supply channel is straightforward. The Strait of Hormuz is not just another waypoint. Roughly 20M b/d of petroleum liquids transits the strait, and only about 2.6M b/d can be rerouted via existing pipeline alternatives. That asymmetry is why oil rallies on threats even when inventories are not critically low. The market does not need a full shutdown to reprice. It only needs credible interference, higher war-risk insurance costs, slower loadings, or a brief reduction in shipping availability.
Policy pressure also compounds the risk premium. A broader sanctions and enforcement posture can reduce effective supply by constraining logistics, payments, and counterparties, even if physical production does not change immediately. The latest U.S. actions include a February 2026 executive order that adds tariff leverage against countries that purchase Iranian goods or services, widening the set of tools that can spill into trade flows and freight behavior.
The breakout is influenced by more than geopolitical factors. Recent U.S. weekly data indicate a significant crude draw to 419.8 million barrels, a decrease of 9.0 million barrels for the week, with refinery utilization at 91.0%. Elevated refinery runs accelerate the translation of risk headlines into price movements. When refineries operate at high capacity, fewer marginal barrels remain to buffer unexpected disruptions, necessitating price adjustments to balance the market.
OPEC+ has diminished market confidence in a sustained downside scenario. The group reaffirmed a pause in planned production increases for February and March 2026 and maintained flexibility regarding the phased return of 1.65 million barrels per day, while emphasizing the ability to pause or reverse additional voluntary adjustments, including the previously implemented 2.2 million barrels per day. This approach effectively establishes a soft floor for prices during periods of macroeconomic uncertainty.
Current market tension and breakout activity occur within a broader context that warrants caution. The prevailing outlook for 2026 suggests that global production capacity and non-OPEC supply growth may outpace demand, leading to higher inventories and downward pressure on prices once geopolitical risk premiums subside. Consequently, this trade should be viewed primarily as a tactical opportunity rather than a structural shift. While headlines can drive short-term price movements, long-term outcomes are determined by balance sheets and storage economics.
Since late January, WTI's price action has established a clear technical pattern: a decline into the high-$50s, a base formation, and a subsequent retest of the $66.50 level, which previously acted as resistance. On February 20, WTI closed at $66.61 with an intraday high of $66.85, representing a marginal yet significant move above this resistance. In breakout trading, such marginal advances are critical. Stop orders tend to accumulate at key levels and, once triggered, can drive price movements beyond what fundamentals alone would justify in a single session.
A practical level map for the next 15 days:
Immediate Resistance Zone: $66.50 to $67.00. A daily close above, followed by acceptance, supports a continuation run toward round-number liquidity.
Next Upside Magnet: $70.00. It is psychological, option-strike-heavy, and typically defended by sellers unless a new catalyst emerges.
First Support Zone: $64.00 to $64.50. If the price breaks out of this zone and then quickly loses it, that is a classic failed breakout signal.
Deeper Support: $62.00-$62.50. A drop back into this band would imply the market is stripping the event premium.
Effective execution is more important than prediction in this context. A frequent pitfall in event-driven crude trading is excessive position sizing based on perceived certainty, which can result in significant losses following unexpected headline reversals. Risk should be defined by setting stop distances that correspond to prevailing volatility, sizing positions accordingly, and anticipating potential price gaps around weekends and policy announcements.
While crude oil remains the primary focus, the impact is distributed unevenly across equities and exchange-traded funds (ETFs).
Oil-Linked ETFs: The United States Oil Fund (USO) often serves as the retail proxy for WTI moves, but it can diverge during roll periods and curve shifts. It is useful for directional exposure, but less useful for precision.
Integrated Majors: Exxon Mobil and Chevron typically express oil strength through free cash flow resilience rather than pure beta. They can participate in rallies while staying less fragile if the premium fades. On the latest read, both were modestly higher on the day, consistent with a risk-on bid rather than an equity panic.
Upstream And Shale Producers: Names like ConocoPhillips, EOG Resources, Occidental, Devon, and Diamondback tend to be more sensitive to oil moves, but they also face higher drawdown risk if crude mean-reverts. For traders, they are better treated as tactical expressions of WTI than as “set and forget” geopolitical plays.
Oilfield Services and Midstream: Schlumberger, Halliburton, Baker Hughes, Kinder Morgan, and Williams can benefit if higher prices extend the activity cycle. The catch is timing. Services and midstream often lag the first impulse rally because investors want confirmation that higher prices will persist long enough to affect capex and throughput.
Refiners represent a secondary trading opportunity, as rising crude prices can compress margins if product prices do not keep pace. Airlines generally serve as an effective negative hedge, as jet fuel costs rise rapidly when crude prices move sharply.
For traders seeking oil exposure without engaging in physical delivery, EBC Financial Group provides access to commodities via contracts for difference (CFD) execution linked to benchmark pricing, as well as platform tools tailored for event-driven markets. The primary advantages include execution speed, flexible position sizing, and the capacity to manage exposure during inventory releases and geopolitical developments.
It is a compressed diplomatic deadline that forces markets to price near-term escalation risk. In crude, the shortest timelines matter most because they directly affect prompt supply expectations, shipping behavior, and risk appetite over weekends and policy announcements.
Because the volume exposure is enormous. About 20M b/d transits Hormuz, while only about 2.6M b/d can be bypassed by existing pipelines. Even a partial disruption changes the global marginal barrel and widens seaborne risk premia.
A sustained daily close above the prior ceiling near $66.50, followed by “acceptance” where pullbacks hold above the breakout level. A fast reversal back under $64 after the break often signals a failed breakout and premium bleed.
Brent usually carries the cleaner geopolitical signal because it reflects seaborne global supply and shipping risk. WTI is more sensitive to U.S. inventory dynamics and pipeline logistics, which can dilute the pure Middle East premium.
Treat gaps as possible, size positions to the stop distance, and avoid building exposure that only works if volatility stays low. Event windows reward defined-risk structures and disciplined exits more than conviction-based averaging.
Upstream producers and smaller E&Ps usually show the highest beta. Integrated majors tend to move less but can be steadier through reversals. Refiners can lag if crude rises faster than product prices, while airlines are often negatively exposed to crude.
WTI’s move through the mid-$60s is a technical breakout, with geopolitical accelerants. The next 10 to 15 days matter because they concentrate tail risk into a short interval where the market must constantly reprice probabilities. The trade, however, is not a blank check for higher prices. Inventory draws and OPEC+ caution provide near-term support, while the 2026 balance still argues that sustained upside requires more than headlines.
In practical terms, the advantage lies not in predicting news events but in trading established market levels, defining risk to prevent reversals from causing significant portfolio impact, and maintaining flexibility to shift from momentum strategies to mean reversion as risk premiums diminish.
Disclaimer: This material is for general information purposes only and is not intended as (and should not be considered to be) financial, investment or other advice on which reliance should be placed. No opinion given in the material constitutes a recommendation by EBC or the author that any particular investment, security, transaction or investment strategy is suitable for any specific person.
(Federal Register)(OPEC)(U.S. Energy Information Administration)