Published on: 2023-06-05
Updated on: 2024-05-23
The RSI indicator is a tool we often use when looking at stock price trends. Because of its clarity, it is a tool that many professional investors will use. So, what are the techniques for using the three lines of RSI indicators? How should we use the three lines of RSI indicators?

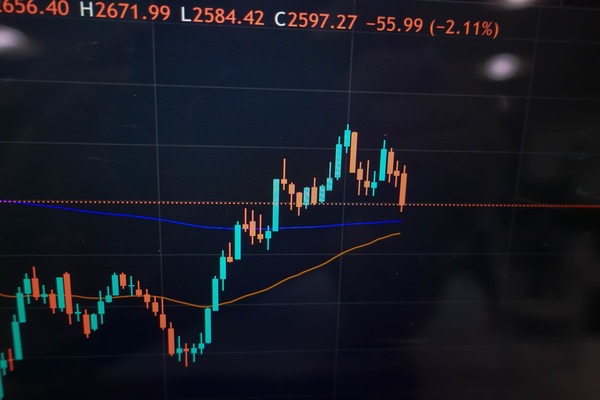
oneRSI line: The RSI line displays the values of relative strength indicators, ranging from 0 to 100. Generally speaking, if the RSI line is above 70, it indicates that the market is in an overbought state; If the RSI line is below 30, it indicates that the market is in an oversold state. When the RSI line breaks through these critical levels, a price reversal may occur.
2. Centerline: The centerline is located above the 50 level, which can help determine the overall trend of the market. If the RSI line is above the centerline, then the market is in an upward trend, and vice versa, it is in a downward trend.
threeUpper and lower limits: The upper and lower limits are located above the 70 and 30 levels, respectively, and are used to confirm overbought and oversold status. If the RSI line crosses the 70 line, the market is in an overbought state; if it crosses the 30 line, the market is in an oversold state. When the RSI line approaches these levels, a price reversal may occur.
What are the Techniques for using the Three Lines of RSI Indicators?
1. When the RSI index line crosses the 72 day line near the RSI value of 50 on the 9th and 12th, if a golden cross appears at this time, it is often a buying signal. At this moment, the RSI index indicates that multi-party forces are gradually stronger than bearish forces, and the stock price will gradually rise. At this point, the stock price will gradually break through the medium to long-term pressure level, and investors can obtain high profits by buying on dips.
2. On the contrary, on the 72nd day, the rsi indicator line drops and falls below the RSI balance line. When the value reaches the 50 balance line, a dead cross will form and the stock price will fall. This is a good selling signal. If some long-term investors continue to have the idea of obtaining higher profits at this time, they often face huge losses.
3. When the RSI index moved below the 50 equilibrium line before the 9th and 12th, suddenly breaking through the equilibrium line at the same time, it indicates that all parties are constantly strengthening their strength and preparing to start, and the stock price will continue to rise.
4. If the stock has gone through a long-term bottom sideways consolidation process before, and once the RSI indicator line breaks through the RSI50 balance line on the 9th, 12th, and 72nd, the stock price is likely to start rising, and investors should buy on dips at this time.
5. When these two short-term RSI run around 80, if the RSI index line rises above 80 on the 9th and 12th, it indicates that the stock price has reached its peak at this time. When the trend of RSI appears on the three lines of the indicator, the stock price will decline in the future, and various forces have been exhausted. At this point, short-term investors need to pay more attention to the stock. Generally speaking, short-term selling signals are strong, and investors should leave the market in a timely manner to carry out short-term selling operations.
6. When the RSI index drops to near the 50 equilibrium line on the 9th and 12th simultaneously, once these two short-term indicators fall simultaneously, they will cross the RSI 50 equilibrium line, and the stock price will fall. Investors should open their positions appropriately at this time. If these two lines rise rapidly again, it means that the stock price will reverse and investors should open or increase their positions.
【 EBC Platform Risk Reminder and Disclaimer 】: There are risks in the market, and investment needs to be cautious. This article does not constitute investment advice.