Published on: 2023-12-11
Updated on: 2026-04-29
Bearish means expecting prices to fall. In stocks, forex, commodities, or indices, a bearish view signals caution because traders believe sellers may have the upper hand. Being bearish does not always mean short-selling. It can also mean reducing exposure, buying protection, taking profit, or waiting for a better entry.
The term matters because market sentiment can shift quickly. In April 2025, the S&P 500 fell 11% over two trading days following major tariff announcements, underscoring how quickly investors can turn bearish when policy uncertainty rises. By 2026, equity markets had recovered strongly, but higher interest rates, expensive valuations, and crowded AI trades still left room for selective bearish views.

Bearish means expecting an asset price to decline.
In stocks, bearish sentiment may lead investors to sell, hedge, buy puts, or avoid new long positions.
A bear market usually refers to a decline of at least 20% from a recent high.
Bearish does not always mean “bad.” It can be a rational view based on weak earnings, valuation risk, or broken technical support.
Very bearish means several negative signals are aligned, such as poor fundamentals, weak momentum, and falling market confidence.
In forex, bearish depends on the currency pair. Being bearish on EUR/USD means expecting the euro to fall against the US Dollar.
The bearish definition is simple: it describes an expectation that prices will move lower. If a trader says they are bearish on a stock, they expect that stock to fall. If an analyst is bearish on oil, they expect crude prices to weaken. If investors are bearish on the market, they expect broader risk assets to decline.
The word comes from the way a bear attacks by swiping downward. A bull attacks by thrusting upward, which is why bullish means expecting prices to rise. This is the basic difference in bullish vs bearish market language.
Bearish sentiment can last minutes, weeks, or months. A day trader may become bearish after a stock breaks intraday support. A fund manager may become bearish on a sector because profit margins are shrinking. A long-term investor may be bearish on the overall market when valuations look stretched and monetary policy remains tight.
In plain English, bearish means the expected direction is lower.
Bearish does not automatically mean a crash is coming. It also does not mean every investor should sell everything. A bearish view is not a guarantee. It is an opinion based on evidence.
A trader can be bearish for one session. An investor can be bearish for one quarter. A portfolio manager can be bearish on one sector while remaining bullish on another. For example, someone may be bearish on highly valued technology stocks but still bullish on defensive healthcare or dividend-paying shares.
Bearish also does not always mean short selling. Many investors express a bearish view by reducing position size, holding more cash, buying put options, or using stop-loss levels. The action depends on risk tolerance, timeframe, and strategy.
A bullish investor focuses on upside potential. A bearish investor focuses on downside risk. Neither view is automatically smarter. Markets reward flexibility, not stubbornness.
The best traders avoid being permanently bullish or permanently bearish. They change their view when earnings, interest rates, liquidity, or price action change.

Bearish in stocks means investors expect a share price, sector, or index to fall. A bearish stock may face slowing revenue growth, weak earnings guidance, rising debt costs, regulatory pressure, insider selling, or a valuation that has moved too far ahead of profits.
For example, an investor may become bearish on a stock if sales growth slows from 20% to 5%, margins contract, and the share price breaks below its 200-day moving average. The company may still be strong in the long term, but the short-term setup has turned negative.
This is important in the current market because many growth stocks remain sensitive to interest rates. When rates stay higher, future earnings are discounted more heavily. That can pressure expensive shares even when the underlying business is still growing. The Fed kept its target range at 3.50% to 3.75% in March 2026, keeping rate expectations central to stock valuation and market sentiment.
Bearish usually leans toward selling or caution, but it is not a direct instruction to sell. A long-term investor may stay invested while recognising short-term downside risk. A trader may sell immediately. A hedge fund may short the stock. A cautious investor may simply avoid buying.
The phrase “bearish means sell or buy” depends on context. If the goal is to protect capital, bearish may mean reducing exposure. If the goal is speculation, it may mean opening a short position. If the goal is hedging, it may mean buying a put option.
A bearish position is a trade designed to benefit from falling prices. The most direct example is short selling. In a short sale, a trader sells a stock they do not own, usually after borrowing it, then aims to buy it back later at a lower price. The SEC defines short selling as selling a stock that the seller does not own or has borrowed for delivery.
Short selling can be profitable when prices fall, but losses can be large if prices rise. A stock can theoretically keep climbing, which makes short selling riskier than simply buying shares.
A put option is another bearish tool. A put gives the buyer the right, but not the obligation, to sell an asset at a set price before expiry. The buyer’s maximum loss is usually limited to the premium paid.
Inverse ETFs and leveraged ETFs may also express bearish views on indices or sectors. These products are usually better suited to short-term trading than to long-term holding, as daily rebalancing and compounding can distort performance over time.

The bearish meaning in forex is slightly different because currencies trade in pairs. If a trader is bearish on EUR/USD, they expect the euro to fall against the US Dollar. If a trader is bearish on USD/JPY, they expect the US Dollar to fall against the Japanese Yen.
Forex traders may become bearish because of weaker growth, lower interest-rate expectations, dovish central bank guidance, trade shocks, or deteriorating risk sentiment. A currency can also weaken when investors move capital into safer or higher-yielding alternatives.
The key point is that forex bearishness must always name the pair. Saying “bearish on the dollar” is incomplete unless the comparison currency is clear. The US Dollar can rise against one currency and fall against another at the same time.
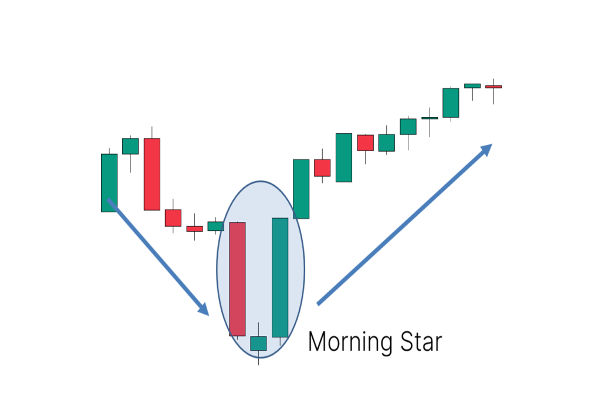
A bearish trend means the price is moving lower, with lower highs and lower lows. It often appears when rebounds are weak, sellers defend resistance, and support levels break.
Bearish signals are not predictions by themselves. They are warning signs. The strongest bearish setups usually appear when price action, momentum, volume, and fundamentals point in the same direction.
A bearish flag is usually a continuation pattern after a decline, not a guaranteed reversal signal. A head-and-shoulders pattern becomes more meaningful only when the price breaks the neckline with convincing momentum. One pattern alone is not enough. Strong analysis needs confirmation.
A bear market is broader than a bearish view. It usually means a market has fallen at least 20% from a recent high. A bearish movement can be much smaller, such as a one-day selloff, failed rally, or sector pullback.
Very bearish conditions usually include several pressures at once: weak breadth, falling earnings estimates, high volatility, tighter liquidity, and repeated failures at resistance. In these periods, investors often sell stocks, rotate into defensive assets, raise cash, or hedge portfolios.
Still, bearish trades can fail quickly. A short squeeze occurs when a heavily shorted asset rises rather than falls. Short sellers may rush to buy back shares to limit losses, which can push the price even higher. This is why risk control matters. A bearish view without a clear invalidation level is not analysis. It is guesswork.
Bearish in stock trading means an investor expects a stock price to fall. The reasons may include weak earnings, an expensive valuation, negative news, or bearish technical signals. A bearish stock is not always a bad company. It may simply be losing momentum or trading above its fair value.
Bearish is not automatically good or bad. It is a market view. A bearish outlook can protect investors from losses if prices fall, but it can also lead to missed gains if markets recover. The quality of a bearish view depends on evidence, timing, and risk control.
Bearish usually points toward selling, hedging, shorting, or reducing exposure. It does not always mean investors must sell immediately. Long-term investors may stay invested while acknowledging short-term downside risk.
Very bearish means downside conviction is strong. This usually happens when several signals align, such as weak fundamentals, poor market sentiment, broken support, and falling momentum. It suggests elevated risk, but it still does not guarantee a decline.
Bearish in forex means expecting the base currency in a pair to weaken against the quote currency. Being bearish on GBP/USD means expecting the pound to fall against the US Dollar.
Bearish means expecting prices to fall, but it is not the same as panic or automatic selling. A bearish view can apply to a stock, currency pair, commodity, sector, or entire market.
The strongest bearish signals usually combine weaker fundamentals, negative sentiment, and confirmed technical breakdowns. For traders and investors, the key is discipline. Define the asset, timeframe, evidence, and risk limit before acting on a bearish view.