What is Bollinger Band Strategy?
The Bollinger Band strategy using the Bollinger Bands indicator is a popular trading strategy that can adapt to any market condition. Created by John Bollinger in the 80's this tool helps traders to analyze volatility and make informed decisions in forex and stocks. By learning the Bollinger Band strategy principles and how to apply it, you can improve your market prediction and Trading plan.
What are Bollinger Bands?
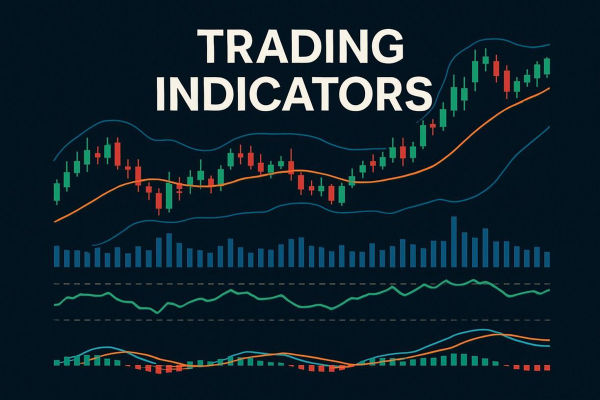
Bollinger Bands are three lines that adapt to market volatility. The optimal Bollinger Bands settings depends on your trading style and market condition. The middle band is a simple moving average (SMA) of 20 periods. The upper band is 2 standard deviations above the SMA and the lower band is 2 standard deviations below the SMA. The bands expand when market is volatile and contract when market is quiet, making them a good tool to identify market conditions.
Bollinger Band Parameters
Bollinger Bands are a technical analysis tool that consists of three parts: a simple moving average (SMA), an upper band and a lower band. The middle band or SMA is the average price of an asset over a certain period, usually 20 periods. The upper and lower bands are calculated by adding and subtracting a certain number of standard deviations from the SMA respectively. This dynamic structure allows Bollinger Bands to adapt to market volatility.
The parameters used in Bollinger Bands are the SMA period, number of standard deviations and the multiplier. The SMA period determines the bands sensitivity. A shorter period like 10 will give you more responsive bands that will follow price closely, good for short term trading. A longer period like 50 will give you smoother bands that are less sensitive to short term fluctuations, good for long term analysis.
The number of standard deviations affects the width of the bands. A higher number of standard deviations like 2.5 will give you wider bands that will capture more price action and reduce false signals. A lower number like 1.5 will give you narrower bands that will be good for identifying tighter range but may give you more false breakouts.
The multiplier is another important parameter that determines the distance between the upper and lower bands from the SMA. By adjusting the multiplier, you can fine tune the bands to your trading style and the instrument you are trading. A scalper will prefer a lower multiplier to catch quick price movement while a swing trader will prefer a higher multiplier to focus on the bigger trend.
Understanding and adjusting these parameters is key to using Bollinger Bands in trading. By setting it to your needs, you can improve your ability to identify trading opportunities and manage risk.

How to Read Bollinger Bands
Interpreting Bollinger Bands is a combination of technical analysis and market sense, so you can identify trend, measure volatility and spot trading opportunities. Here are some ways to read Bollinger Bands:
Trend Identification: The direction of the middle band or SMA is a good indicator of the trend. An upward sloping middle band means the price is trending up, the asset's price is generally going up. A downward sloping middle band means the price is trending down, the price is generally going down. You can use this to align your trades with the market direction.
Volatility Measurement: The width of the bands is a measure of volatility. Wider bands means higher volatility, the price is moving more away from the SMA. Narrower bands means lower volatility, the price is closer to the SMA. By looking at the band width you can measure the current volatility and adjust your strategy accordingly.
Overbought or Oversold: When the price touches or breaks the upper or lower band it can be an overbought or oversold condition. A touch or break above the upper band means the asset is overbought, a selling opportunity. A touch or break below the lower band means the asset is oversold, a buying opportunity. But these signals should be confirmed with other indicators to avoid false signals.
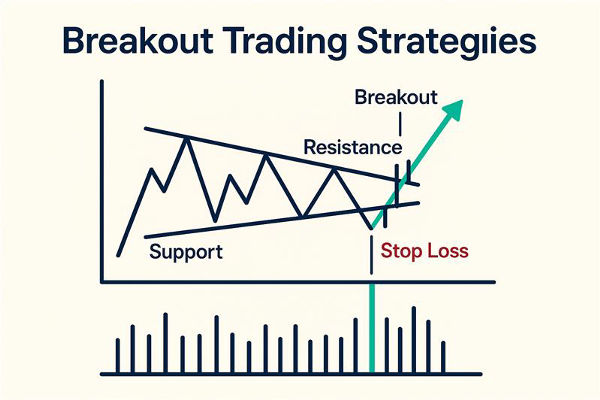
Breakouts: Big price movement often happens after a period of low volatility, called a "squeeze" where the bands contract. When the price breaks the upper or lower band after a squeeze it can be a breakout. You can use this to spot trading opportunities but you need to confirm the direction of the breakout with other indicators to be sure.
By learning these ways to read Bollinger Bands you can use it to make informed trading decisions and ride the market.
How Bollinger Bands Strategy Works
Bollinger Bands strategy is based on mean reversion and price volatility. One way to use it is to look for places where the price deviates from the middle band. When the price touches the upper band it may be overbought, a selling opportunity. When the price touches the lower band it may be oversold, a buying opportunity.
Breakouts is another way to use Bollinger Bands. When price breaks above the upper band it's often bullish, when price breaks below the lower band it's bearish. But you should confirm these signals with other indicators like RSI or MACD to avoid false breakouts. Another way is the double Bollinger Bands strategy which uses two sets of bands to generate more accurate buy and sell signals.
One of the key feature of Bollinger Bands is the "squeeze" where the bands contract. This is a low volatility condition and often precedes big price movement. Although the squeeze is a breakout signal, the direction is not predetermined so it's recommended to combine it with momentum indicators for better accuracy.
Applications in Different Markets
Bollinger Bands strategy is very versatile and can be used in different markets. In forex trading Bollinger Bands help to identify overbought and oversold conditions for currency pairs. For example when EUR/USD touches the lower Bollinger Band traders may consider it as a buying opportunity if supported by other indicators.
In stock trading Bollinger Bands is good for swing traders. Stocks that show a "squeeze" pattern often have big price movement especially when price breaks above the upper Bollinger Band so this strategy is good for traders who want to ride short to medium term market movement.
Risk Management for Bollinger Bands Trading
Risk management is very important when trading with Bollinger Bands. Here are some ways to manage risk and protect your capital:
Stop-Loss Orders: Placing stop-loss orders is a basic risk management technique. For long trades put stop-loss below the lower band to limit your loss if price moves against you. For short trades put stop-loss above the upper band. This way you can get out of losing trades before you incur big loss.
Position Sizing: Adjusting your position size according to the asset's volatility and your risk tolerance is crucial. By calculating your position size you can limit your exposure to risk. For example in highly volatile market smaller position size can help to reduce the impact of big price movement.
Risk-Reward Ratio: Having a favorable risk-reward ratio is the key to successful trading. A risk-reward ratio of at least 1:2 means the potential profit of a trade is twice the potential loss. So even if some trades lose you will still be profitable overall.
Trade Management: Using trade management techniques such as trailing stops and scaling out can help to manage your trades better. Trailing stops move the stop-loss as the price moves in your favor, lock in profits and let the trade continue. Scaling out means closing part of your position as the price reaches certain levels, reducing risk and securing profits.
By using these risk management techniques you can improve your Bollinger Bands strategy, minimize your losses and maximize your gains. Risk management not only protect your capital but also leads to long term trading success.

Mistakes and Tips for Success in Overbought or Oversold Conditions
Bollinger Bands is effective but traders should avoid common mistakes. One advanced technique to consider is the double Bollinger Bands strategy which can help filter out false signals and improve trade accuracy. One mistake is Overtrading, not every price touch on the bands is a valid trade. Another is ignoring the bigger picture. Bollinger Bands works best in range bound markets and may produce less reliable signals in strong trends.
To use this strategy you should combine Bollinger Bands with other indicators like RSI or MACD. Adjust the bands settings like changing the SMA period to fit your trading style. Risk management is equally important; set stop-loss for every trade so your capital is protected if the market moves against you.
Conclusion
Bollinger Bands are a valuable tool for traders navigating volatile markets. They help spot overbought or oversold conditions, breakouts, and volatility patterns, making it easier to predict market movements. However, success with this strategy requires careful planning, solid risk management, and combining it with other indicators. Whether you're trading forex or stocks, Bollinger Bands can be a reliable addition to your trading toolkit.
Disclaimer: This material is for general information purposes only and is not intended as (and should not be considered to be) financial, investment or other advice on which reliance should be placed. No opinion given in the material constitutes a recommendation by EBC or the author that any particular investment, security, transaction or investment strategy is suitable for any specific person.
