The momentum indicator is one of the most widely used tools in technical analysis. It helps traders assess the strength of a market trend and predict possible reversals or continuations. But what exactly is it, and how does it work?
This article explores the five essential things you need to know about the momentum indicator and its role in modern trading.
5 Things to Know About the Momentum Indicator
1. What Is the Momentum Indicator?
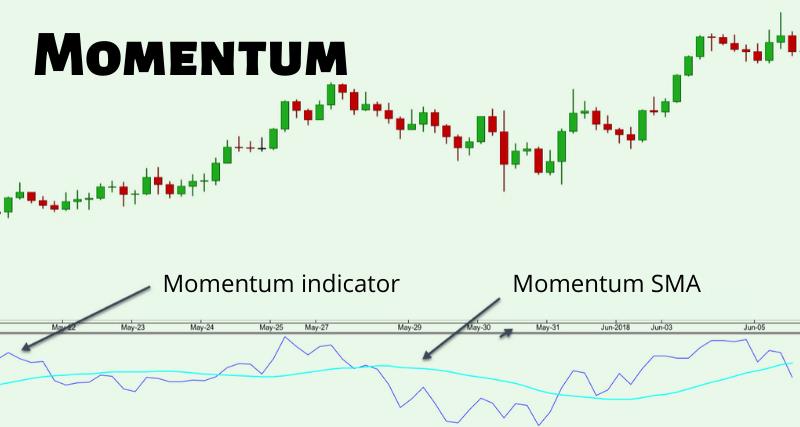
At its core, the momentum indicator is a tool that measures the rate of change in an asset's price over a specific period. It does not provide buy or sell signals directly but instead gauges the speed of price movements. Traders use this information to identify whether a trend is gaining or losing strength.
The basic formula subtracts the closing price of a security from a previous closing price set several periods back. A positive value suggests upward momentum, while a negative one signals downward momentum. This makes the indicator useful in both trending and ranging markets.
2. How It Differs from Other Indicators
It's easy to confuse the momentum indicator with others like the Relative Strength Index (RSI) or the Moving Average Convergence Divergence (MACD). However, the momentum indicator is unique in that it focuses purely on the rate of change rather than overbought or oversold conditions.
Unlike oscillators that move between fixed boundaries (such as RSI), the momentum indicator fluctuates above and below a central zero line. This simplicity is why many traders use it in conjunction with other tools for confirmation. It offers raw insight into price velocity without interpretation bias.
3. When to Use It in Your Trading Strategy
The momentum indicator is most effective when used during trending markets. A rising indicator above the zero line typically suggests strong buying pressure, while a falling one below zero indicates selling dominance. However, flat momentum readings can warn of potential consolidations or reversals.
For example, if the price continues rising but the momentum indicator starts declining, it may signal weakening trend strength—a phenomenon known as bearish divergence. Conversely, bullish divergence occurs when the price drops but momentum rises, hinting at a potential turnaround.
To get the most from this tool, traders often combine it with support and resistance levels or candlestick patterns to strengthen their analysis.
4. It Works Best With Confirmation
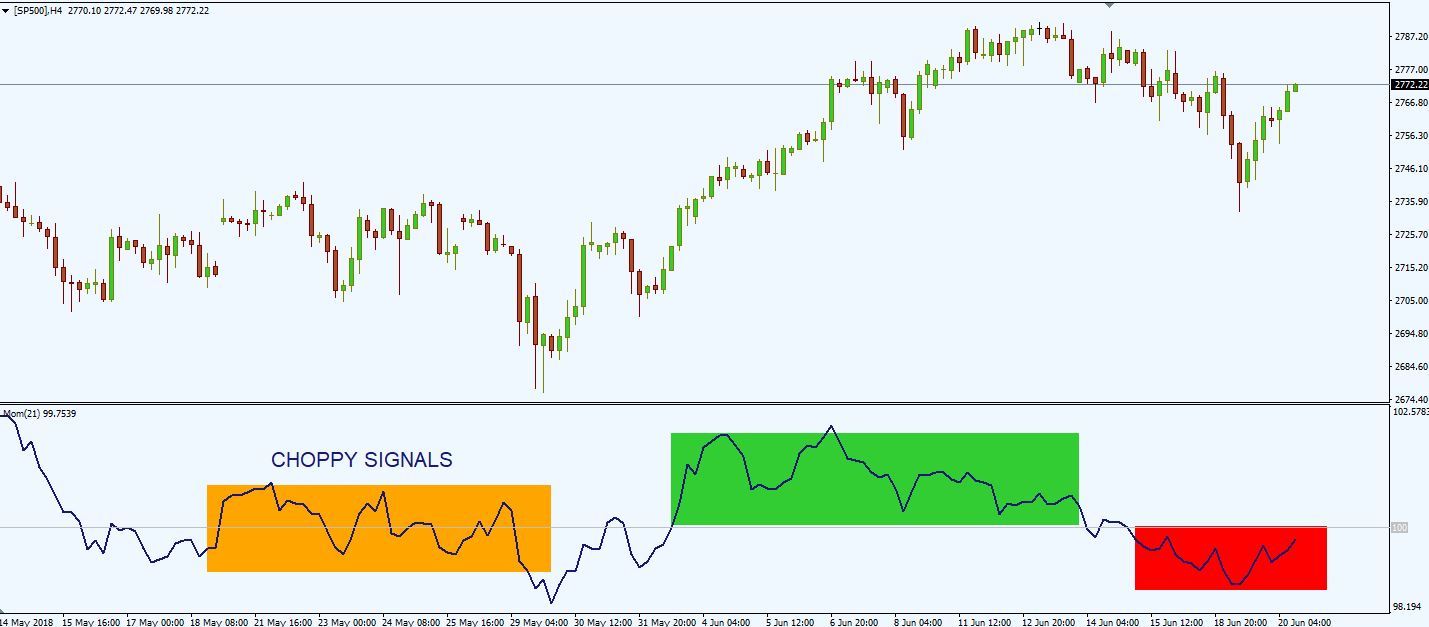
While the momentum indicator is powerful, relying on it alone can lead to false signals. Momentum can appear strong due to short-term volatility, only to fade quickly if not supported by volume or trend continuation. This is why traders often seek confirmation from other indicators or price action patterns.
Some use moving averages to filter signals, confirming a trade only if both the trend direction and momentum agree. Others wait for breakouts to align with rising momentum for a more conservative entry. Either way, using momentum as part of a broader toolkit increases the probability of successful trades.
5. It's Flexible Across Markets and Timeframes
One of the standout qualities of the momentum indicator is its adaptability. It can be applied to forex, stocks, commodities, and indices across different timeframes. Whether you're a day trader monitoring 5-minute charts or a swing trader focusing on daily candles, the momentum indicator can provide valuable insights.
Adjusting the period used in the formula allows the trader to control its sensitivity. A shorter period will make the indicator more responsive to recent price moves, while a longer one will smooth out the data, reducing noise but potentially delaying signals. This customisability makes it suitable for various trading styles and market conditions.
Final Thoughts
The momentum indicator remains a staple in the toolbox of technical analysts for good reason. Its ability to measure the speed and strength of price movements gives traders a critical edge in identifying trend dynamics. By understanding how it works, how to apply it, and when to pair it with other tools, traders can unlock clearer signals and refine their market timing.
For those new to technical analysis, starting with the momentum indicator offers a simple yet effective way to understand market psychology and price behaviour.
Disclaimer: This material is for general information purposes only and is not intended as (and should not be considered to be) financial, investment or other advice on which reliance should be placed. No opinion given in the material constitutes a recommendation by EBC or the author that any particular investment, security, transaction or investment strategy is suitable for any specific person.
