Published on: 2025-07-21
Updated on: 2025-11-14
In trading, spotting high-probability chart patterns is the difference between guesswork and consistently profitable decisions.
Among these setups, the Volatility Contraction Pattern (VCP) is notable because it shows when big professional traders are quietly buying, often leading to a strong price breakout.
Originally popularised by veteran trader Mark Minervini, this pattern has become a core tool for growth and momentum traders seeking strong entries with clearly defined risk.
This guide explains how the VCP works, why it matters, and how traders use it to position ahead of major price expansions with confidence and precision.
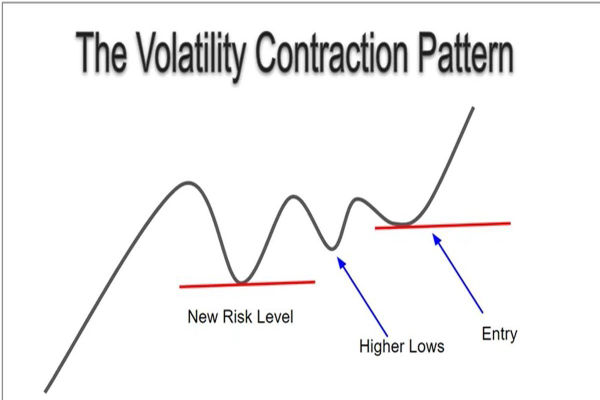
 The Volatility Contraction Pattern (VCP) reflects a progressive tightening in price behaviour as an asset consolidates within a defined base.
This compression signals that selling pressure is diminishing; when underlying demand persists, the conditions for a decisive breakout begin to build.
The structure is characterised by a sequence of increasingly smaller pullbacks, each contraction highlighting reduced volatility and improved price stability.
Volume often follows suit; light during contractions as supply dries up, then expanding sharply on the breakout as institutional buyers step in.
When the VCP forms within an established uptrend, it can precede a powerful continuation move, making it a preferred setup for traders seeking high-quality entries with clearly measurable risk.
A base or consolidation period
A series of contractions (smaller pullbacks)
Decreasing volume on pullbacks
Support above major moving averages
A breakout point with volume confirmation
While similar consolidation patterns have existed in technical analysis for decades, the VCP was named and popularised by Mark Minervini, a U.S. Champion Trader and author of Trade Like a Stock Market Wizard.
Minervini used the VCP as part of his SEPA (Specific Entry Point Analysis) trading system, which emphasises:
Trading leading stocks
Using tight risk-reward setups
Entering just before the price expansion
His success, documented with triple-digit annual returns, has made VCP a staple pattern among momentum, swing, and position traders.

At its core, the VCP pattern reflects a psychological tug-of-war between buyers and sellers.
In the early stages of the base, volatility is high as sellers take profits or exit their positions. However, over time, these sellers become exhausted, and buyers begin to step in at higher lows.
The result? Each pullback is smaller and more shallow, indicating strength. Eventually, there's so little selling pressure left that the stock explodes to the upside once buying demand returns, often triggered by a breakout catalyst such as earnings or news.
This process is what Minervini calls "the tightening of the spring." Once it's tight enough, the release (breakout) can be powerful.

Step 1: Identify the Base
Identify a strong stock or asset that is consolidating after experiencing an upward trend. Use daily or weekly charts. The base should have:
Several weeks of sideways movement
Defined support and resistance levels
Step 2: Spot the Contractions
Draw horizontal lines at each contraction's top and bottom. Each new contraction should be tighter than the last.
Step 3: Monitor Volume Trends
During contractions, volume should decrease. Right before a breakout, volume may hit multi-week lows, a strong VDU signal.
Step 4: Entry at Breakout
Place your entry just above the last contraction's high. Wait for:
A breakout candle with above-average volume
Ideally, a strong close above resistance
Step 5: Set Your Stop Loss
Your stop loss should be just below the most recent contraction low, minimising downside risk.
Step 6: Ride the Trend
Once in, manage the trade using:
10/21/50-day moving averages
Partial profit-taking at measured moves (1:2 or 1:3 risk/reward)
The VCP works best in:
Bull markets
Breakout or continuation phases
Strong sectors or industry groups
Stocks with high earnings growth or technical momentum
It's less effective in:
Bear markets
Highly volatile or illiquid stocks
Sideways ranges without institutional interest
| Step / Timeframe | What Happens / Behavior of VCP | What to Watch For / Trading Insight | Why It Matters |
|---|---|---|---|
| Initial Base Formation | Price consolidates after an uptrend | Wide swings in price | Shows the stock is pausing before the next move |
| Contractions Begin | Pullbacks and rallies get smaller | Higher lows, lower highs, decreasing volume | Indicates sellers are losing strength |
| Volume Dry-Up (VDU) | Volume drops very low | Very light trading | Signals few sellers remain; sets stage for breakout |
| Breakout Zone | Price breaks above the last contraction | Surge in volume, price clears resistance | Confirms buyers are taking control; high probability of upward move |
| Timeframe | Behavior of VCP | Trading Insight |
|---|---|---|
| Weekly | Shows long-term base and multiple contractions over weeks or months | Ideal for position traders identifying major breakout candidates and trend direction |
| Daily | Captures shorter consolidations and clearer contraction sequences | Useful for swing traders timing entries and managing risk |
| Intraday (1–60 min) | Highlights rapid contractions and minor breakouts | Best for day traders or scalpers seeking short-term moves; requires tight risk control |
| Multi-Timeframe Alignment | Weekly trend confirms overall direction; daily/intraday patterns refine precise entry points | Combining timeframes increases probability of successful breakout trades |
Let's consider a stock like Nvidia (NVDA). After a sharp rally on AI-driven earnings, the stock consolidated for 6 weeks.
Week 1-2: Price drops 15% with high volume.
Week 3-4: Drops only 8% with lower volume.
Week 5-6: Pullback contracts to just 4%, volume hits lowest in 2 months.
In week 7, NVDA broke out on an earnings beat and 3x normal volume, leading to a 30% rally in 10 trading days. It is a textbook VCP breakout.
While the VCP offers a great risk-reward profile, traders often make errors that can ruin the setup.
1. Entering Too Early
Many traders jump in before a confirmed breakout, only to get caught in a false move or deeper contraction.
2. Ignoring Volume
Breakouts without volume confirmation often fail. Always look for above-average volume.
3. Loose Stop Losses
VCP trades require tight risk control. If your stop is too wide, it defeats the purpose of the pattern.
4. Not Waiting for Contractions
A valid VCP pattern must have at least 2-3 clear contractions. Entering after only one pullback may not offer enough confirmation.
A valid VCP typically has 2-5 clear contractions, each smaller than the previous. Fewer may not provide enough confirmation for a reliable breakout.
Volume should decrease during contractions (showing sellers are exiting) and spike at the breakout, confirming strong buying demand.
Yes. Weekly charts highlight long-term bases for position traders, daily charts help swing traders refine entries, and intraday charts (1-60 min) work for day traders, but require tight risk management.
In conclusion, the Volatility Contraction Pattern is more than a conceptual framework, its structure and mechanics have shown practical effectiveness across diverse market environments.
By zeroing in on controlled consolidations, disciplined volume behaviour, and well-defined breakout points, traders applying the VCP can secure asymmetric opportunities: limited downside paired with meaningful upside potential.
This approach not only improves trade selection but also strengthens risk management, making it a valuable component of a systematic trading strategy.
Disclaimer: This material is for general information purposes only and is not intended as (and should not be considered to be) financial, investment or other advice on which reliance should be placed. No opinion given in the material constitutes a recommendation by EBC or the author that any particular investment, security, transaction or investment strategy is suitable for any specific person.


World's Best Broker