Published on: 2026-09-14
Updated on: 2026-09-14

A portfolio can contain dozens of stocks, funds and other assets while still relying heavily on the same companies, sectors or economic forces. Counting positions alone therefore gives an incomplete picture of diversification.
A clearer assessment comes from examining where capital is actually allocated, which underlying companies are owned and which common risks could affect several investments at once.
A large number of holdings does not automatically mean that portfolio risk is widely diversified.
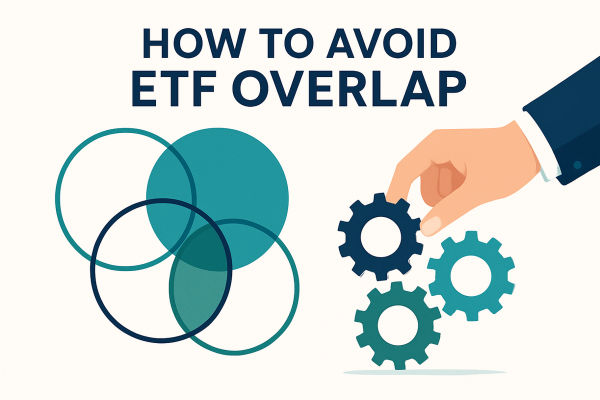
ETF overlap can increase exposure to the same company even when investments appear separately in a brokerage account.
The effective number of holdings can help measure whether portfolio weights are more concentrated than the headline investment count suggests.
Capital concentration and risk concentration are different because volatility, correlation and factor sensitivity also influence how much risk each position contributes.
Sector, geographic and macroeconomic exposures can create concentration across investments that initially appear unrelated.
Portfolio concentration describes the extent to which investments depend on a relatively narrow group of companies, sectors, markets or economic conditions.
The clearest example is a portfolio in which one company represents a large percentage of total value. Concentration can also be less visible.
Suppose a portfolio owns five large technology companies, two technology-focused ETFs and a broad growth fund whose largest positions include several of the same businesses. Eight separate investments appear on the account, but much of the capital may ultimately depend on a smaller group of companies and similar market conditions.
The same issue can occur in larger portfolios. Twenty or thirty securities may appear diversified by number while remaining exposed to similar industries, economic cycles or market factors.
The number of holdings therefore describes how many positions exist. It does not reveal how many genuinely different sources of risk those positions represent.
Sector concentration is one of the easier forms of hidden exposure to identify.
A semiconductor manufacturer, cloud-computing business, cybersecurity provider and software company operate in different parts of the technology industry. Their revenues and share prices will not behave identically, but several common forces can affect them together.
Higher interest rates may put pressure on growth-company valuations, while weaker corporate technology spending could affect demand across several parts of the sector.
The same principle applies outside technology. Banks, insurers and asset managers, for example, may all respond to changes in credit conditions, interest rates and economic growth.
Holding several companies can reduce dependence on one individual business while still leaving significant exposure to the same industry or economic environment.
Funds can make concentration harder to recognise because each may contain dozens or hundreds of securities.
A portfolio might hold a broad US equity ETF, a growth ETF and a technology ETF. Each follows a different index or methodology, yet their largest holdings may include many of the same companies.
The overlap becomes clearer when the underlying exposure is calculated.
Suppose a portfolio has:
10% invested directly in Company A
30% in ETF X, where Company A represents 8% of the fund
40% in ETF Y, where Company A represents 6% of the fund
The portfolio's total exposure to Company A is:
10% + (30% × 8%) + (40% × 6%) = 14.8%
The brokerage account displays three separate investments, but 14.8% of the portfolio is ultimately exposed to the same company.
This type of calculation is known as a look-through assessment. Rather than treating each ETF as a single investment, it examines the securities held inside the fund and their respective weights.
Fund names can indicate broad objectives, but holdings and index methodologies reveal whether separate ETFs are providing genuinely different exposure or repeatedly allocating capital to many of the same businesses.
Broad market coverage does not necessarily mean that capital is distributed evenly across every constituent.
MSCI reported that, as of April 2026, the ten largest companies represented 37.5% of the MSCI USA Index, compared with 10.9% of the MSCI EAFE Index. The difference illustrates how two broad equity benchmarks can have very different levels of concentration despite both containing hundreds of companies.
BlackRock similarly reported in April 2026 that the 20 largest companies in the S&P 500 accounted for about 49% of the index and contributed approximately 64% of its five-year return.
Owning a broad-market fund can therefore provide exposure to many companies without giving every company an equal influence over the portfolio.
Concentration is not limited to companies operating in the same industry.
A portfolio may contain businesses from several sectors while remaining highly sensitive to the same economic variable.
Interest rates provide one example. Banks, property companies, utilities, long-duration bonds and highly valued growth stocks can all react to changes in borrowing costs, although the direction and magnitude of those reactions may differ.
Other shared influences can include:
economic growth;
inflation;
consumer spending;
oil and gas prices;
credit conditions;
exchange rates;
government policy.
Several holdings can therefore carry different company names and sector classifications while responding to the same macroeconomic environment.
Looking at the drivers of earnings, valuations and cash flows can reveal connections that are difficult to see from ticker symbols alone.
Geographic diversification is also more complicated than the location of a stock exchange suggests.
Retailers, banks, property companies and telecommunications businesses listed in the same country may belong to different sectors but still depend heavily on the health of the domestic economy.
Multinational companies create another layer.
A US-listed company may earn a significant proportion of its revenue in Europe or Asia, while a European business may depend heavily on demand from China or the United States. Listing location therefore does not always represent the company's underlying economic exposure.
Currency movements can further affect the picture. Companies with overseas revenue may see reported earnings influenced by exchange-rate movements, while international funds can introduce foreign-currency exposure alongside their underlying equity exposure.
Examining where revenues and profits are generated can provide a more complete picture than country labels alone.
A portfolio that starts with balanced allocations may become more concentrated simply because its investments perform differently.
Consider ten stocks initially representing 10% each. If two rise substantially while the remaining eight change very little, the successful positions will gradually account for a greater proportion of the portfolio.
No additional purchase is required.
Over longer periods, sustained gains in a particular company or sector can produce considerable portfolio drift. Reinvested dividends or repeated allocations towards recent winners can increase the imbalance further.
The result is that a portfolio which was evenly distributed when constructed may look very different several years later.
Regularly examining current weights rather than relying on original allocations can reveal how far that distribution has changed.
Concentration can be assessed at several levels. No single measure captures every form of exposure, so combining basic weight-based measures with a broader assessment of common risk drivers gives a more complete view.
| Capital concentration | Where the portfolio's money is allocated |
| Look-through concentration | Which companies are actually owned through direct positions and funds |
| Sector or theme concentration | Which industries or investment themes dominate |
| Factor concentration | Which economic or style factors affect several holdings |
| Risk concentration | Which positions or exposures contribute most to overall portfolio risk |
One of the simplest measures is to calculate how much of the portfolio is represented by its largest positions.
A portfolio may contain 40 securities, but the headline count becomes less informative if five of them account for half of total value.
The same approach can be applied to sectors, countries and underlying ETF holdings.
A more formal measure is the effective number of holdings.
MSCI describes the effective number of stocks as a concentration measure calculated using the inverse of the Herfindahl-Hirschman Index. It ranges from one for a single-stock portfolio to the actual number of holdings when all positions are equally weighted.
The calculation is:
Effective holdings = 1 ÷ Σ(weight²)
Consider a hypothetical ten-stock portfolio:
one stock represents 40%;
another represents 20%;
the remaining eight represent 5% each.
The concentration calculation becomes:
0.40² + 0.20² + 8 × 0.05² = 0.22
Therefore:
1 ÷ 0.22 = approximately 4.5
The account contains ten stocks, but its weighting is equivalent to roughly 4.5 equally weighted holdings.
That makes the difference between nominal holding count and capital concentration measurable rather than purely conceptual.
The metric does have limits. Twenty equally weighted semiconductor companies could produce an effective holding count close to 20 even though the portfolio remains heavily dependent on the semiconductor industry.
Effective holdings can reveal concentration caused by unequal weights, but it does not fully account for correlation or shared economic drivers.
Portfolio weights also do not reveal how much risk each investment contributes.
A position accounting for 10% of portfolio capital does not necessarily contribute exactly 10% of portfolio risk.
Its contribution also depends on factors such as:
its volatility;
its correlation with other holdings;
its sensitivity to common market factors.
A volatile security that moves closely with several other positions may contribute disproportionately to overall portfolio fluctuations. Conversely, an investment with the same capital weight but lower volatility or weaker correlation with the rest of the portfolio may contribute less.
MSCI research on benchmark concentration similarly distinguishes portfolio weight from risk contribution and has found that the largest stocks can contribute a greater share of index risk than their portfolio weight alone would indicate.
Measures such as factor exposure and risk contribution generally require more detailed portfolio analytics. For a basic concentration review, top-position weights, sector allocations, ETF look-through exposure and effective holdings can already provide considerably more information than investment count alone.
Concentration is not inherently undesirable.
Some portfolios are deliberately focused on a smaller number of companies, industries or themes, while others are designed to spread exposure across a broader range of assets.
The greater concern is concentration that develops without being recognised.
A portfolio may contain numerous line items while remaining heavily dependent on a narrow group of companies or economic conditions. If those shared exposures come under pressure, several positions may weaken at the same time.
There is therefore no universal number of holdings that guarantees sufficient diversification. Ten investments representing different sources of risk could provide broader exposure than 30 securities clustered around the same companies, sector, region or economic theme.
Adding more positions without examining how they interact can increase complexity without necessarily reducing concentration.
Portfolio diversification cannot be judged solely by counting how many securities appear in an account.
Underlying company weights, ETF overlap, sector exposure, geography, economic sensitivities and portfolio drift can all create concentration that is difficult to recognise from the headline holding count.
Measures such as top-position weight, look-through exposure and effective holdings can help quantify capital concentration, while correlation, factor analysis and risk contribution provide a deeper view of how portfolio risk is distributed.
The more useful question is therefore not simply how many investments a portfolio contains, but how many genuinely different sources of risk those investments represent.