Published on: 2025-07-07
Updated on: 2025-09-26
In technical analysis, price action holds the key to understanding market sentiment and forecasting future moves. Among the various Chart Patterns traders use, the bullish rectangle pattern stands out as a reliable continuation formation that signals the potential for further upward momentum.
This comprehensive guide explains the bullish rectangle pattern, outlines its formation, details trading strategies, and provides practical examples in incorporating it into your toolbox.

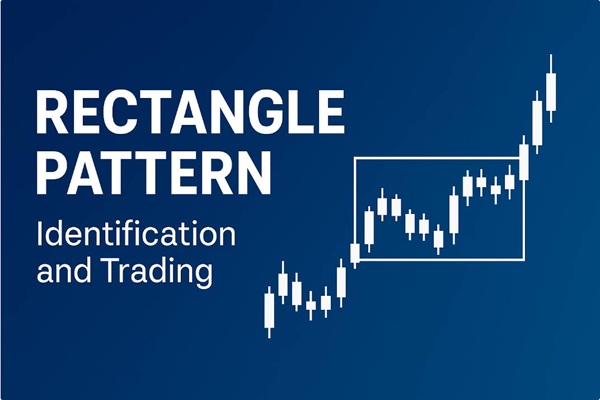
A bullish rectangle pattern is a continuation pattern that occurs during an uptrend. It forms when the price consolidates between two horizontal support and resistance levels before breaking out to the upside. Despite the sideways movement during the pattern formation, the overall trend remains bullish.
This pattern illustrates a conflict between buyers and sellers, where neither party prevails over time, leading to prices oscillating within a specific range. Ultimately, positive momentum regains dominance, resulting in a breakout past the resistance line and a continuation of the upward trend.
The bullish rectangle typically has the following traits:
Formed during an uptrend
Horizontal resistance and support lines that are tested multiple times
Volume decreases during consolidation and often increases during the breakout
Breakout direction is upward, in line with the prior trend
The pattern reflects a pause in the bullish move where the market takes a breather before continuing higher. It represents accumulation and a buildup of buying pressure that ultimately leads to a breakout.
While the bullish rectangle occurs during an uptrend, its counterpart, the bearish rectangle, forms in a downtrend. Here's how the two differ:
| Feature | Bullish Rectangle | Bearish Rectangle |
|---|---|---|
| Trend direction | Uptrend | Downtrend |
| Breakout direction | Upward | Downward |
| Trading bias | Long | Short |
| Volume at breakout | Increases | Increases |

Identifying this pattern requires attention to both price action and volume behaviour. Here's how to spot it:
Uptrend Presence: First, the market must already be in a clear uptrend before the rectangle forms.
Sideways Price Action: Price then enters a period of consolidation, bouncing between well-defined horizontal support and resistance levels.
Multiple Touches: At least two touches on both support and resistance lines are required to define the rectangle.
Breakout to the Upside: After the consolidation, the price breaks above the resistance level, confirming the bullish rectangle pattern.
The longer the rectangle persists and the more touches on the boundaries, the more significant the eventual breakout tends to be.

Once the pattern is identified, there are several ways to approach trading it. The key objective is to capitalise on the breakout while minimising risks.
Traders usually enter long positions after a confirmed breakout above the rectangle's resistance level. A breakout is confirmed when:
The candle closes significantly above resistance
Volume increases during the breakout, validating buying interest
Some conservative traders prefer to wait for a retest of the broken resistance, which may now act as support, before entering the trade.
A stop-loss is typically placed below the support level of the rectangle or slightly under the breakout candle's low. It protects against false breakouts or sudden market reversals.
The price target is usually estimated by measuring the height of the rectangle and projecting that distance upward from the breakout point.
For example, if the rectangle spans from R100 to R110 (a height of R10), and the breakout occurs at R110, the target would be around R120.
Let's look at a practical scenario.
Assume that the stock of a major tech company is in an uptrend, moving from R80 to R120. The price then consolidates between R120 and R130 for several days, forming a rectangle. Multiple tests of support (R120) and resistance (R130) occur, but no clear breakout happens initially.
Eventually, robust earnings announcements result in a bullish surge past R130, accompanied by significant volume. Traders enter a long position, setting a stop-loss near R120 and targeting R140 (R130 + the R10 range of the rectangle). The trade unfolds, and the stock reaches the anticipated level in a few sessions.
To increase the reliability of trades based on the bullish rectangle, traders often combine it with technical indicators. Some of the most effective tools include:
Moving Averages: An up-sloping 50-day or 200-day moving average beneath the pattern adds confluence.
Relative Strength Index (RSI): A bullish divergence on the RSI during consolidation may indicate an upcoming breakout.
MACD: A bullish MACD crossover near breakout time strengthens the buy signal.
Fibonacci Retracement: The pattern may form around key Fib levels, offering additional confirmation.
The bullish rectangle can appear on any timeframe, from intraday charts to weekly charts. However, success rates and breakout follow-throughs tend to be better on higher timeframes (4-hour, daily, or weekly).
Assets with strong trending behaviour are ideal for spotting this pattern, such as:
Major currency pairs in forex (e.g., EUR/USD, GBP/JPY)
Stocks with momentum (e.g., tech or biotech sectors)
Commodities during bull runs (e.g., gold or crude oil)
Traders should match their strategy and risk appetite to the volatility of the chosen asset.
Trading the bullish rectangle pattern can be profitable, but many traders fall into avoidable traps:
Entering Before Breakout: Jumping in during consolidation can lead to whipsaw movements. Always wait for a confirmed breakout.
Ignoring Volume: A breakout without volume is suspicious. Volume validates the price action.
Neglecting Risk Management: Failing to implement a stop-loss puts your trade at risk of significant losses if there is a reversal.
Overestimating Targets: Although the projection technique is useful, always consider market circumstances that could limit price fluctuations.
Chasing the Breakout: Entering too late can result in poor reward-to-risk ratios. Be ready with alerts and trade plans in advance.
In conclusion, the bullish rectangle is one of the most powerful continuation patterns when used with proper analysis and risk management. It allows traders to capitalise on market pauses and gain entry into ongoing trends with well-defined risk-reward profiles.
While no pattern guarantees profits, the bullish rectangle remains a high-probability setup that continues to deliver value to traders who apply it with discipline and strategy.
Disclaimer: This material is for general information purposes only and is not intended as (and should not be considered to be) financial, investment or other advice on which reliance should be placed. No opinion given in the material constitutes a recommendation by EBC or the author that any particular investment, security, transaction or investment strategy is suitable for any specific person.


World's Best Broker