Published on: 2025-06-24
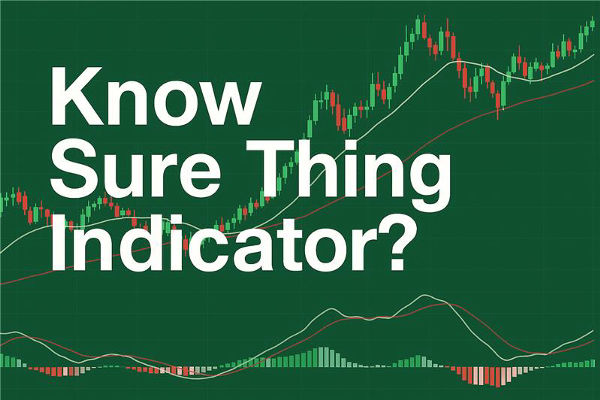
In technical analysis, traders rely on a wide variety of momentum indicators to identify potential buy and sell signals. One such momentum oscillator that has gained popularity among seasoned market participants is the Know Sure Thing (KST) indicator.
Developed by renowned market analyst Martin Pring, the KST assists traders in identifying significant trend reversals and measuring momentum by integrating various rate-of-change indicators into a singular smooth signal.
In this guide, you'll learn everything you need to know about the Know Sure Thing indicator, including how it works, how to interpret it, and how to apply it to your trading strategy.

The Know Sure Thing (KST) is a momentum oscillator that measures the rate of change over four different time frames and combines them into a single indicator. The purpose is to smooth short and long-term price movements, providing a more comprehensive picture of market momentum.
Key Characteristics:
Type: Momentum indicator
Purpose: To identify trend reversals and confirm trend strength
Components: Two lines (KST line and Signal line)
By incorporating multiple time frames, KST filters out short-term noise and delivers more reliable momentum signals, particularly for swing and position traders.
Understanding the signals from the KST involves analysing the crossover between the KST line and the signal line, as well as observing the direction of the indicator relative to the zero line.
1. Bullish Signal
When the KST line crosses above the signal line, it suggests upward momentum.
A cross above the zero line confirms a potential bullish trend.
2. Bearish Signal
When the KST line crosses below the signal line, it indicates bearish momentum.
A cross below the zero line confirms a bearish trend.
3. Divergence
If the price forms a new high but the KST fails to follow, it could signal weakening momentum (bearish divergence).
If the price forms a new low but KST doesn't, it could suggest a bullish reversal (bullish divergence).
The KST indicator works by calculating the rate-of-change (ROC) of a price over four separate periods. These ROCs are then smoothed using moving averages and assigned different weightings. The resulting values are combined to form the KST line. A moving average of the KST line is then plotted as the signal line.
The Basic Formula:
KST = ROC1 × SMA1 + ROC2 × SMA2 + ROC3 × SMA3 + ROC4 × SMA4
Where:
ROC = Rate of Change
SMA = Simple Moving Average of each ROC
Default Settings (as used by Martin Pring):
ROC Periods: 10, 15, 20, 30
SMA Periods: 10, 10, 10, 15
Signal line = 9-period SMA of the KST
These default settings can be customised depending on the asset and timeframe.

Traders use the KST indicator for several purposes: trend confirmation, momentum measurement, divergence spotting, and as a buy and sell signal generator.
Common Use Cases:
Trend Confirmation: Use KST to validate trends seen in moving averages or price patterns.
Entry Signals: A bullish crossover can signal a buy, especially if it happens above the zero line.
Exit Signals: A bearish crossover, particularly below the zero line, may indicate it's time to exit.
Divergence Detection: Look for divergence between price and KST for early reversal signs.
Best Timeframes
Swing traders: Daily and 4-hour charts
Position traders: Weekly charts
Investors: Monthly charts

1. KST Crossover Strategy
How it works:
Enter a long trade when the KST line crosses above the signal line.
Enter a short trade when the KST line crosses below the signal line.
Use the zero line as a filter. Only take long trades if KST is above zero; only take short trades if KST is below zero.
Tip: Combine with price action patterns (e.g., support and resistance) for more accurate entries.
2. KST with Moving Averages
How it works:
Use a 50-period or 200-period simple moving average (SMA) on the chart.
If the price is above the SMA and KST gives a bullish crossover, it strengthens the buy signal.
If the price is below the SMA and KST gives a bearish crossover, it increases the sell signal.
Why it works: Aligning with trend direction improves win probability.
3. Divergence Strategy
How it works:
Watch for higher highs in price but lower highs in KST (bearish divergence).
Watch for lower lows in price but higher lows in KST (bullish divergence).
Enter trades in the direction of divergence once price action is confirmed (e.g., engulfing candle or trendline break).
Caution: Divergences can persist. Wait for confirmation before acting.
Avoid using KST alone: Incorporate it with other indicators such as RSI, moving averages, or support and resistance zones.
Use in trending markets: KST works best when there is a clear trend; avoid ranging or low-volatility periods.
Be cautious near the zero line: Crossovers around zero can produce false signals—wait for confirmation.
Customise the settings: Adjust the ROC and SMA parameters to match the volatility of the asset you're trading.
In conclusion, the Know Sure Thing indicator offers a unique and powerful way to assess market momentum across multiple timeframes. While it may not be as popular as MACD or RSI, it provides rich information for swing and position traders looking to anticipate trend changes and confirm momentum.
When used in conjunction with proper risk management, price action, and other indicators, KST can become a valuable component of your trading strategy. Like all tools, its effectiveness depends on how well you understand and implement it.
Disclaimer: This material is for general information purposes only and is not intended as (and should not be considered to be) financial, investment or other advice on which reliance should be placed. No opinion given in the material constitutes a recommendation by EBC or the author that any particular investment, security, transaction or investment strategy is suitable for any specific person.