Once hyped as an up-and-coming EV disruptor, Mullen Automotive is now a cautionary tale of dilution, reverse stock splits, and an eventual delisting from Nasdaq.
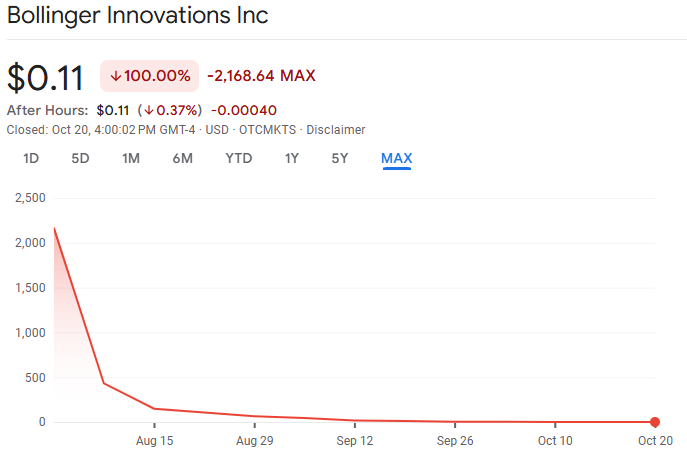
As of October 2025, the company, recently renamed Bollinger Innovations, Inc. (BINI), has officially been removed from the Nasdaq exchange, marking the symbolic end of one of the most spectacular microcap collapses in EV history.
From a once-buzzing retail favourite with bold promises, Mullen's market capitalisation has essentially evaporated. What remains is a pivoted shell of its former self, an attempt to rebuild around Bollinger Motors, its commercial EV division.
This article revisits what went wrong, what's changed in 2025, and what the delisting means for investors.
2025 Reality Check: Nasdaq Delisting & Name Change
The most significant turning point came in October 2025.
1) Delisted from Nasdaq
Mullen, now Bollinger Innovations, was delisted from the Nasdaq after failing to maintain the $1 minimum bid price for 10 consecutive days. [1]
It marked the end of Mullen's presence on major U.S. exchanges. Investors holding the stock now face illiquidity, as the shares may trade only over-the-counter (OTC) under limited volume conditions.
2) Corporate Rebranding to Bollinger Innovations (BINI)
Mullen's last strategic move before delisting was to consolidate ownership of Bollinger Motors, its Michigan-based EV subsidiary focused on commercial electric trucks and vans.
Earlier in July 2025, Mullen announced its official rebranding to Bollinger Innovations, Inc., shifting its ticker from MULN to BINI. [2]
The rebranding aimed to distance the company from the failed Mullen brand and highlight its commercial EV operations through Bollinger Motors, which Mullen had previously acquired a 95% stake in.
However, even Bollinger remains a niche player, producing limited quantities for fleet and utility markets. Analysts question whether it can generate enough volume or capital to sustain itself without significant new funding, something nearly impossible for a delisted microcap.
What Triggered the Mullen Automotive Stock Crash?

1. Unfunded Ambitions and Broken Promises
Mullen unveiled a lineup of advanced electric vehicles, each a significant advancement in design or technology. For example, the Dragonfly K50 supercar, Mullen FIVE SUV, Mullen Three, and Mullen Go delivery truck. In reality, most never progressed beyond prototype stages.
Independent investigations and shareholder lawsuits revealed that the Dragonfly was largely a rebadged Qiantu K50, and the company's claims of "in-progress EPA-certified production" were false.
These revelations culminated in a $7.25 million legal settlement for shareholders who alleged that Mullen misled the market about its vehicles and manufacturing readiness.
2. Massive Financial Losses & Cash Burn
Financially, Mullen's model was unsustainable. Despite reporting about $3 million in revenue in early 2025, its net losses exceeded $114 million that quarter, including $91 million in non-cash charges. [3]
The company repeatedly spent $40–50 million each quarter, making it dependent on brief stock sales and debt conversions for survival.
As of Q3 2025, total year-to-date losses exceeded $300 million, with auditors expressing concerns about its "going concern" status. While Mullen managed to reduce total debt from over $30 million to around $10 million through aggressive restructuring, the balance sheet remained fragile and investor dilution extreme, with billions of shares outstanding.
3. Nano-Cap Illiquidity & Panicked Selling
By mid-2025, Mullen's market cap plunged below $1 million, making it one of the most illiquid nano-caps in the EV sector. A single large sell order or downgrade could trigger cascading stop-losses, and that's exactly what happened in June when a 25% plunge erased most of the remaining market value.
Technical traders characterised the collapse as a typical liquidity spiral, where violations of psychological support levels initiated automated liquidations, pushing shares below $0.001
As of October 2025, Mullen's shares are listed on the OTC market with the symbol MULN, frequently priced under $0.0005 per share, making the equity virtually valueless.
The company's story from hype-fueled social media darling to penny-stock cautionary tale now serves as a warning about unchecked speculation in the EV boom era.
Investor Impact: A Near-Total Wipeout
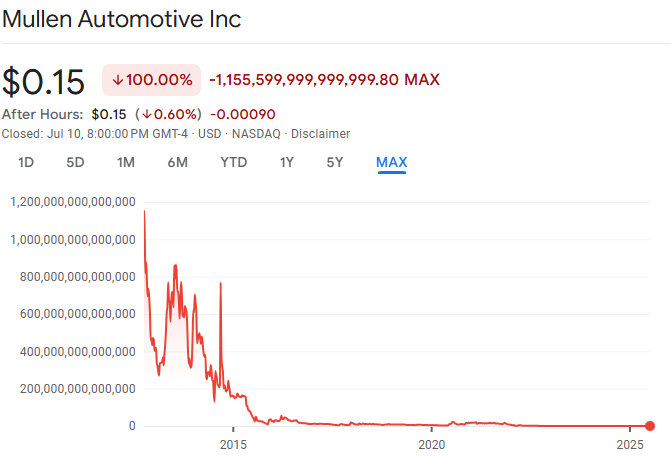
For retail investors, the Mullen story ended not with a bang, but with a delisting notice.
By October 2025, MULN shares were worth fractions of a cent before the final reverse split, effectively wiping out most shareholder value.
After the delisting, even those who still hold positions face massive liquidity challenges, as BINI stock trades in unregulated OTC markets, if at all.
What began as an EV dream stock for Reddit traders and retail momentum investors has ended as a stark warning about over-dilution and speculative hype cycles.
Lessons from the Mullen Collapse
While the details are unique, the underlying lessons echo through every speculative boom:
1. Reverse Splits Don't Fix Fundamentals
Each time Mullen split its shares, it merely postponed delisting. Without genuine demand, profitability, or execution, these mechanical fixes could not restore market confidence.
2. Excessive Dilution is a Death Spiral
Mullen's financing model relied on frequent share issuance to stay solvent. This created a feedback loop where each new rise further depressed prices.
3. Retail Hype ≠ Institutional Endorsement
Mullen's popularity on Reddit and YouTube was never matched by serious institutional backing. Once retail sentiment turned, there was no support floor.
4. Brand Reboots Can't Erase Balance Sheets
Even the 2025 rebranding to Bollinger Innovations couldn't hide the damage. Investors and regulators still viewed the company through Mullen's checkered history.
Can Bollinger Innovations Survive?
Theoretically, yes, but only as a tiny private-like manufacturer, not a mainstream EV competitor.
Bollinger's fleet-targeted vehicles (B1, B4 trucks, and delivery vans) have technical promise but operate in a crowded field alongside Rivian's commercial division, Ford's E-Transit, and GM's BrightDrop.
Without Nasdaq access, attracting new capital becomes almost impossible. Unless Bollinger Innovations finds a major partner or buyer, its survival odds remain slim.
In essence, the stock story is over. What remains is a quiet attempt to salvage a working business from the wreckage.
Frequently Asked Questions
1. Is Mullen Automotive Still Trading?
No. As of October 2025, Mullen (now Bollinger Innovations) has been removed from Nasdaq and is no longer tradeable.
2. How Much Money Has Mullen Lost Overall?
Over $500 million in cumulative net losses since 2021, according to SEC filings.
3. Is This the Biggest Dilution Case in EV History?
One of them. Mullen's nine reverse splits and multi-billion share issuance are among the most extreme.
4. What's Next for Bollinger Innovations?
Possible small-scale commercial EV operations, or an acquisition by a larger player seeking tax-loss benefits or manufacturing assets.
Conclusion
In conclusion, the delisting of Mullen Automotive marks the end of an era for one of the most speculative EV stocks ever listed. What began as a bold vision to challenge Tesla ended as a sobering example of overpromising, underdelivering, and dilating investors to zero.
While Bollinger Innovations may continue operating in some form, it's no longer a mainstream publicly traded EV company.
For investors, the Mullen saga is a reminder that in the electric vehicle boom, not every spark becomes a flame, and some burn out.
Disclaimer: This material is for general information purposes only and is not intended as (and should not be considered to be) financial, investment or other advice on which reliance should be placed. No opinion given in the material constitutes a recommendation by EBC or the author that any particular investment, security, transaction or investment strategy is suitable for any specific person.
Sources
[1] https://www.ft.com/content/65c1643c-6f4e-4fa6-befb-b59e0e6294be
[2] https://investors.bollingerev.com/
[3] https://news.bollingerev.com/mullen-announces-quarterly-results-for-3-months-ended-march-31-2025
