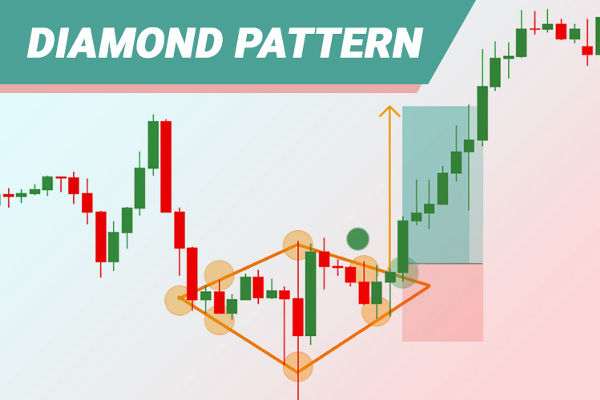
The broadening formation is made up of two distinct trendlines. The upper trendline connects the successively higher highs, while the lower trendline links the successively lower lows. Unlike channels, which maintain a relatively equal distance between support and resistance, the broadening formation widens over time. This divergence is the hallmark of the pattern.
For the formation to be considered valid, the price should make at least two touches on each trendline, although more touches strengthen its reliability. The expansion of the price range suggests that the market is losing consensus about value, with buyers willing to pay increasingly higher prices and sellers equally willing to accept increasingly lower prices.
Volume often plays a crucial role in confirming the pattern. In many cases, trading activity intensifies as the formation develops, reflecting growing participation and volatility. Traders who monitor both price and volume have a better chance of distinguishing a genuine broadening formation from random market noise.

Types of Broadening Formation
Not all broadening formations are the same. The differences lie in the slope of the trendlines and the context in which the pattern appears. Recognising the variation you are dealing with helps in tailoring the appropriate trading strategy.
An ascending broadening formation occurs when both the highs and lows are rising, but the highs are rising at a faster pace. This variation typically forms in bullish conditions and signals a market with strong buying pressure tempered by significant selling interest. While it can lead to upward breakouts, traders should not ignore the possibility of a reversal if selling pressure overpowers buyers.
A descending broadening formation is the opposite, with both highs and lows falling, but the lows drop more sharply. This pattern appears more often in bearish markets, reflecting persistent selling pressure with increasingly aggressive counterattacks from buyers. While it may ultimately break lower, there are also instances where strong buyer momentum flips the trend.
The symmetrical broadening formation features highs and lows that expand at roughly equal rates. This version shows a market where buyers and sellers are evenly matched, making direction less predictable. The eventual breakout can go either way, often driven by external catalysts such as news events or shifts in broader market sentiment.
Trading Within the Pattern
Some traders choose to operate inside the broadening formation rather than waiting for a decisive breakout. This approach involves trading the swings between the upper and lower trendlines, essentially buying when price approaches the lower line and selling near the upper line in bullish or symmetrical patterns, or shorting near the upper line and covering near the lower in bearish patterns.
The advantage of this strategy is that it allows multiple trades before the final breakout, potentially capturing profits from each swing. The challenge is that volatility within the formation can cause abrupt reversals, making stop-loss placement critical. Stops should be placed just beyond the trendlines to account for overshoots without exposing the position to excessive loss.
This style of trading requires confidence in reading intrapattern price action and discipline in sticking to pre-defined entry and exit rules. Without these, the erratic moves that define the broadening formation can lead to premature exits or poorly timed entries.
Breakout Trading Strategy
The alternative approach is to wait for a confirmed breakout from the broadening formation before taking a position. A breakout occurs when the price closes beyond one of the trendlines with noticeable momentum, often accompanied by a spike in volume.
An upward breakout from an ascending broadening formation may signal that buying pressure has finally overpowered sellers, offering a potential long entry. Traders can enter as the breakout candle closes, placing a stop-loss just below the breakout level. In contrast, a downward breakout from a descending broadening formation can confirm bearish momentum, prompting a short entry with a stop above the breakout point.
Patience is vital with this strategy, as broadening formations are prone to false breakouts. Waiting for confirmation through multiple closes beyond the trendline or additional volume surges can help filter out traps.
Avoiding Common Mistakes
One of the most common pitfalls is misidentifying random price swings as a broadening formation. Without clear and consistent expansion in highs and lows, what looks like a pattern could simply be erratic price action. Another mistake is overtrading within the formation without respecting its volatility, which can lead to frequent stop-outs.
Impatience is another hazard. Jumping into a trade before the breakout is confirmed can result in being caught in a false move. Likewise, failing to adjust position sizing to account for the wider price range increases risk unnecessarily.

Practical Examples from Market Charts
Historical charts provide plenty of examples where the broadening formation preceded significant moves. In equity markets, this pattern often emerges during periods of economic uncertainty, where earnings announcements, macroeconomic reports, or geopolitical developments amplify volatility. In forex markets, it may appear around major central bank decisions or political events.
By studying past examples, traders can gain insights into how the pattern behaves in different markets and under varying conditions. This research reinforces the importance of combining pattern recognition with broader market analysis.
Final Thoughts
The broadening formation is a powerful tool in a trader’s pattern recognition arsenal, but like all chart patterns, it works best when used in conjunction with other forms of analysis. Its expanding price range reflects a battle of wills between buyers and sellers, one that can culminate in sharp, decisive moves.
Whether you choose to trade within the pattern or wait for a breakout, success depends on disciplined execution, sound risk management, and patience. Recognising the signs early and understanding the psychology behind the broadening formation allows traders to turn what might look like chaotic price action into a structured trading opportunity.
For traders willing to put in the work to master it, the broadening formation offers a chance to thrive in volatile markets rather than be sidelined by them.
Disclaimer: This material is for general information purposes only and is not intended as (and should not be considered to be) financial, investment or other advice on which reliance should be placed. No opinion given in the material constitutes a recommendation by EBC or the author that any particular investment, security, transaction or investment strategy is suitable for any specific person.


