Published on: 2023-09-20
Updated on: 2026-05-19
RSI bottom deviation is useful because it warns that selling pressure is weakening before the price fully turns. The signal matters most after a sharp decline, when traders need to judge whether a rebound is short-covering or the start of a genuine reversal.
The concept is simple: price makes a lower low, while the Relative Strength Index forms a higher low. This mismatch shows that sellers pushed the price down again, but with less momentum. In 2025 and 2026, that distinction became more important as tariff shocks, AI-led equity rotations, and gold volatility triggered rapid reversals that punished traders who relied solely on oversold RSI.

RSI bottom deviation forms when price prints a lower low, but RSI forms a higher low.
The signal is strongest near major support, prior demand, or a clear liquidity sweep.
A break above the high point between the two lows is the main confirmation signal.
An RSI below 30 indicates oversold conditions, while the 30-40 zone can signal an early recovery.
False signals are common when the price remains below the 20-day and 50-day moving averages.
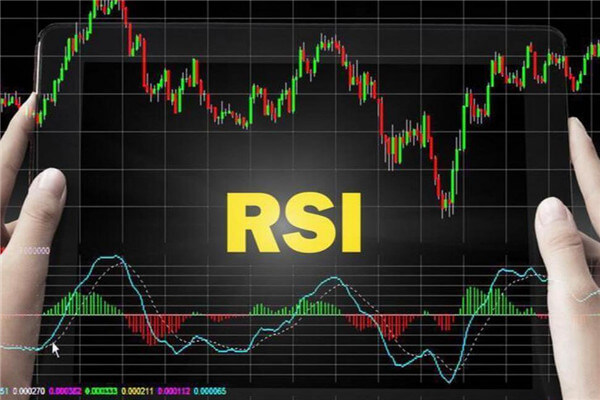
The Relative Strength Index is a momentum indicator that ranges from 0 to 100. Traditional RSI analysis treats readings above 70 as overbought and readings below 30 as oversold. Those levels are useful, but they are not automatic buy or sell signals. In strong trends, RSI can stay overbought or oversold longer than expected.
RSI bottom deviation, also called a bullish RSI divergence, occurs when the price makes a new low but RSI fails to confirm it. For example, a currency pair falls from 1.0800 to 1.0600, rebounds to 1.0700, then drops again to 1.0550. If RSI rises from 24 at the first low to 34 at the second low, the market has made a lower low with higher momentum.
That is the core message. The trend is still down, but the force behind the decline is fading. The signal does not say “buy now.” It says sellers may be losing control.
A clean RSI bottom deviation usually has three parts.
First, price records the first low after a decline. RSI typically drops into oversold territory or near it. Second, price rebounds and creates a temporary high. This height becomes the reference level. Third, price falls again, creating a lower low, while RSI forms a higher low.
The high point between the two lows is the most important price level in the pattern. It separates a weak rebound from a confirmed reversal attempt.
If the price fails to break above that high point, the setup remains incomplete. The market may only be pausing before another decline. If the price closes above that high point with stronger volume or a wider candle body, the structure changes. Sellers have lost the short-term sequence of lower highs, and buyers have gained control of the next swing.
The RSI warning comes first. The price breakout confirms whether the warning has trade value.
Not every divergence deserves attention. The best RSI bottom deviation setups appear where the price already has a reason to turn.
The first strong location is major support. This can be a previous swing low, a weekly demand zone, or a round-number level watched by the market. A divergence at 1.0500 in EUR/USD, $100 in crude oil, or $5,000 in an equity index carries more weight than one forming in the middle of a weak downtrend.
The second strong location is a liquidity sweep. Price briefly breaks a prior low, triggers stop-loss orders, then quickly recovers. If RSI makes a higher low during that sweep, the setup suggests forced selling has been absorbed.
The third strong location is a higher-timeframe uptrend. In bull markets, the RSI often finds support in the 40-50 range rather than falling below 30. A higher RSI low in that area can signal trend continuation rather than a full reversal.
The safest method is to treat RSI bottom deviation as a setup, not an entry trigger.
Start by marking the two price lows and the RSI lows. The pattern is valid only when the price makes a lower low, and RSI makes a higher low. If both price and RSI make lower lows, there is no bullish divergence.
Next, draw a horizontal line at the high point between the two lows. This is the confirmation level. A candle close above it carries more meaning than an intraday spike. On higher timeframes, daily confirmation is usually stronger than a short-lived move on a five-minute chart.
Then check supporting evidence. Volume should improve on the breakout. Price should reclaim a short-term moving average, such as the 20-day EMA, or break a falling trendline. A bullish engulfing candle or strong close near the session high adds weight.
Finally, define invalidation before entry. The second low is the key level. If the price breaks below it after confirmation, the setup has failed.
Modern markets show why confirmation matters. In April 2025, tariff uncertainty triggered one of the sharpest volatility episodes of the cycle. The VIX briefly spiked to 60, and the S&P 500 fell more than 21% intraday from its February peak before recovering later in the month. Many assets looked oversold during that period, but RSI alone did not identify which rebounds would hold.
The same lesson applies in 2026. AI-related equities have helped major U.S. indices reach fresh highs, but concentration risk means pullbacks can move quickly when large technology names lose momentum. Gold also remains sensitive to policy uncertainty, central-bank demand, and geopolitical risk. In these conditions, RSI bottom deviation is useful only when paired with structure.
The first mistake is buying when RSI rises from oversold territory. A move from 25 to 35 can show reduced selling pressure, but the price may still be in a firm downtrend.
The second mistake is ignoring the moving averages. A bullish divergence below the 20-day, 50-day, and 200-day averages is a counter-trend signal. It needs stronger confirmation and smaller position sizing.
The third mistake is treating every divergence equally. A signal near weekly support is different from a signal inside a falling channel. Location determines quality.
The fourth mistake is entering before the high point breaks. Early entries may work, but they carry a higher failure risk.
It is an early warning, not a standalone buy signal. The pattern becomes stronger only after the price breaks above the high point between the two lows.
The 14-period RSI is the standard setting. Shorter settings react faster but create more false signals. Longer settings are slower but often more reliable for swing trading.
Yes. It fails often in strong downtrends, especially when the price remains below major moving averages or when macro news reinforces selling pressure.
RSI bottom deviation helps traders identify the moment when a decline loses momentum. It does not predict every bottom, and it should never replace price confirmation.
The strongest signal combines three elements: a lower price low, a higher RSI low, and a breakout above the high point between the two lows. When this structure appears near support, after a liquidity sweep, or within a larger uptrend, the odds improve.
Used properly, RSI bottom deviation gives traders a disciplined way to read exhaustion, avoid chasing weak rebounds, and wait for evidence that buyers have regained control.
Disclaimer: This material is for general information purposes only and is not intended as (and should not be considered to be) financial, investment or other advice on which reliance should be placed. No opinion given in the material constitutes a recommendation by EBC or the author that any particular investment, security, transaction or investment strategy is suitable for any specific person.