Published on: 2025-10-24
Updated on: 2025-10-24
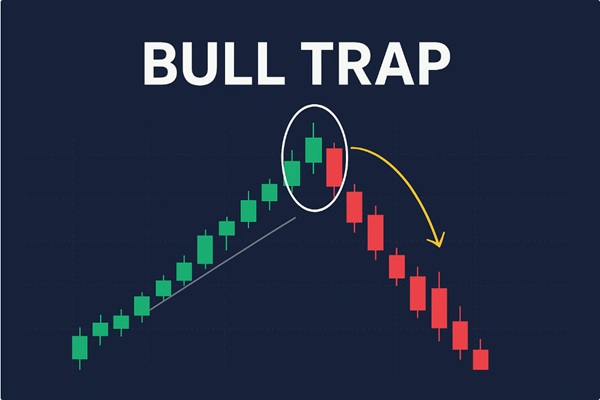
A bull trap occurs when a market appears to break higher, drawing in buyers, only for the price to reverse sharply and decline.
It's a deceptive pattern that catches traders off guard, turning optimism into sudden loss. Understanding the bull trap meaning is essential for anyone who trades in volatile markets.
This article explains why bull traps form, how to identify them with technical and behavioural cues, and how prudent traders mitigate risk or exploit the reversal.

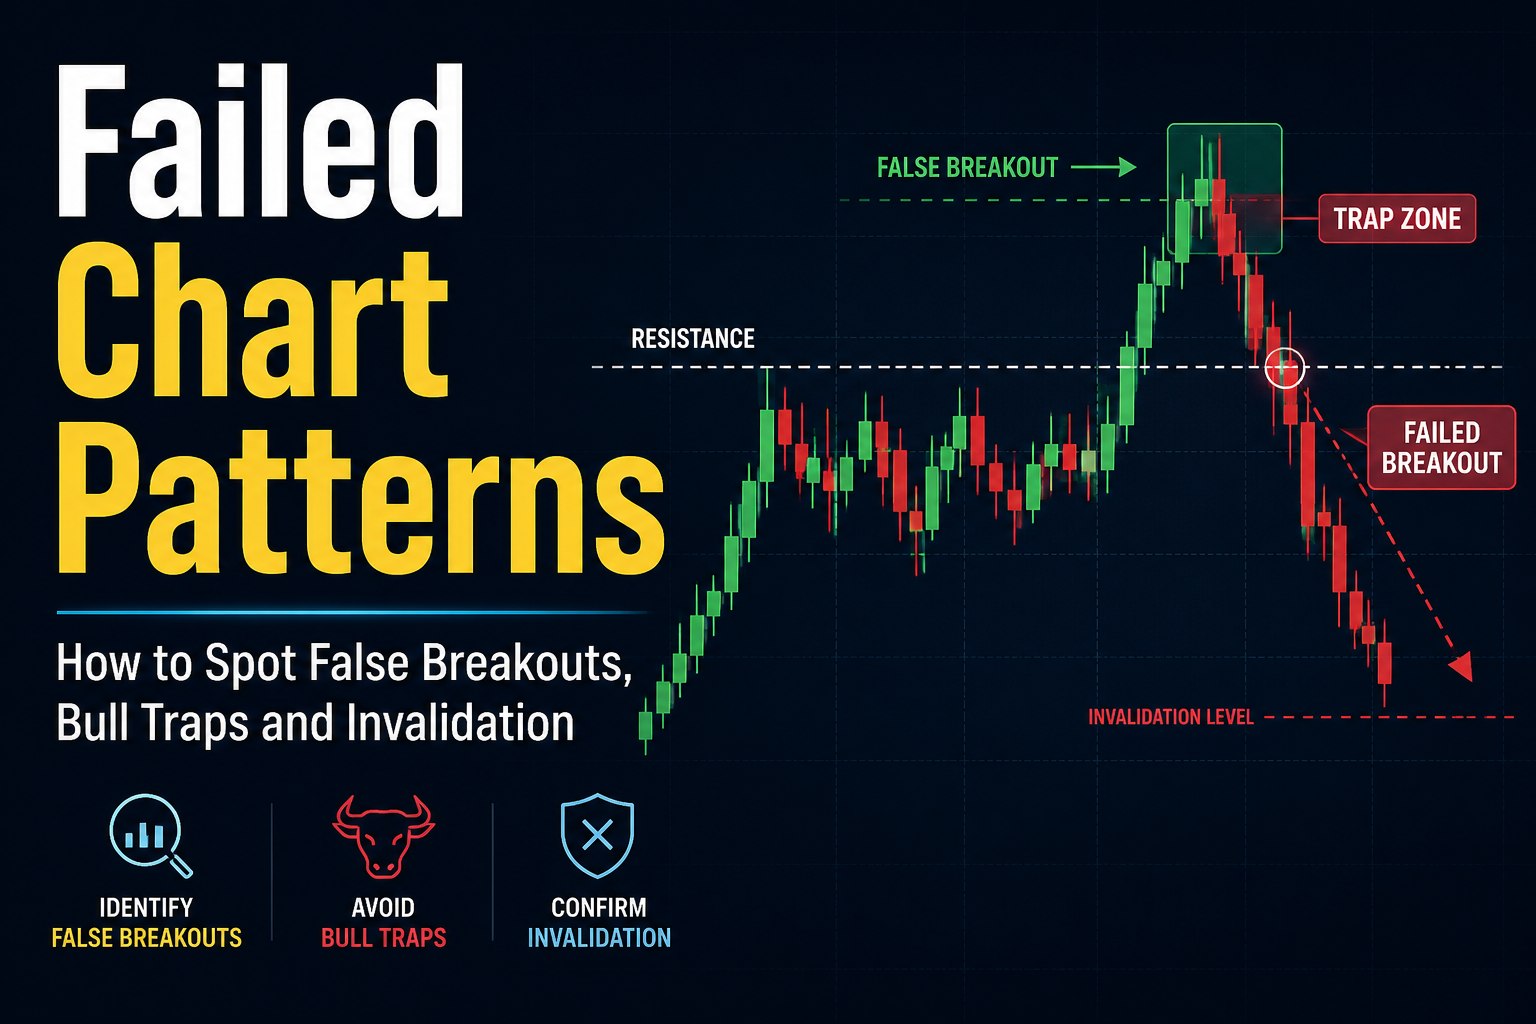
A bull trap occurs when an apparent breakout above a resistance level or a convincing upward move induces market participants to take long positions, only for the price to reverse rapidly and decline.
The term emphasises the entrapment of bullish traders who commit capital under the false impression that a bullish trend has resumed or established itself.
Key characteristics of a bull trap:
A breakout or strong upward move that attracts buying interest.
Relative weakness beneath the surface, typically evidenced by low volume or negative momentum divergence.
A subsequent rapid reversal that invalidates bullish positions and often accelerates selling.
This definition highlights that a bull trap is not merely a pullback; it is a specific pattern in which mean expectations of continuation are violated and result in losses for those who enter on the apparent strength.

Bull traps arise from a combination of market structure and participant psychology.
Downtrends and consolidations produce frequent false breakouts because supply remains higher than demand, even when price moves briefly above resistance.
Low liquidity or thin trading during the breakout permits a small number of buyers to lift price temporarily without broad-based participation.
News events or algorithmic activity can produce rapid spikes that lack sustained follow-through.
Fear of missing out leads traders to enter on breakouts without adequate confirmation.
Confirmation bias prompts traders to interpret ambiguous signals as support for a bullish view.
Herd behaviour amplifies initial buying, creating a superficial appearance of strength.
Understanding these causes is essential because they determine both the signal quality of a breakout and the means by which traders should validate or dismiss it.
Identification combines technical indicators with contextual assessment. No single indicator is definitive; rather, effective identification rests on a convergence of warning signs.
Volume profile:
Breakouts that occur on lower-than-average volume are suspect. A legitimate breakout typically coincides with increased volume signalling widespread participation.
Momentum divergence:
When the price makes a higher high but momentum indicators, such as RSI or MACD, fail to confirm, the breakout may lack strength.
Failed retest:
A common pattern is a breakout followed by a rapid decline below the breakout point after a weak or failed retest.
Candle structure:
Long wick or shooting-star style candles following a breakout indicate rejection of higher prices.
Macro backdrop:
Weak macro data or tightening liquidity often supports the probability of false breakouts.
Sector leadership:
If the breakout occurs in a lagging sector or stock without sectoral confirmation, the risk of a bull trap increases.
News quality:
Headlines that are ambiguous, non-fundamental, or short-lived (for example, rumours) are less likely to produce sustainable moves.
| Signal Category | Positive confirmation for breakout | Warning sign for bull trap |
|---|---|---|
| Volume | Increasing volume on breakout | Low or declining volume |
| Momentum | Indicator confirms higher highs | Divergence or weakening momentum |
| Price action | Clean breakout and sustained retest | Rejection candles, failed retest |
| Context | Supportive macro and sector data | Weak economy or ambiguous news |
The following is a representative scenario used to explain mechanics and decision points.
A stock has been in a downtrend for several months, forming a horizontal resistance zone after a period of consolidation.
On Day 1. the stock gaps up and closes above the resistance level. Media outlets report a minor favourable development, generating retail interest.
Traders and momentum-following systems buy into the breakout. Volume on Day 1 is modest and below the 30-day average.
On Day 2. momentum indicators do not confirm the new high. The price fails to hold above the breakout level during intraday trading and produces a long upper wick.
On Day 3. a heavy sell order triggers stops placed beneath the breakout level, causing the price to fall sharply and trap recent buyers.
Traders who entered on Days 1 or 2 face losses; those who waited for confirmation or placed prudent stops limit damage. Short sellers or contrarian traders who recognise the failed breakout can profit from the reversal.
This stepwise account emphasises the importance of volume confirmation, momentum alignment, and the utility of stops and position sizing.

Risk management and entry discipline are primary defences against bull traps.
Wait for a retest of the breakout level that holds as support or for a second session of strong volume before initiating a full-sized position.
Enter immediately with a small initial position and scale in only after verification of strength.
Place stops at levels that reflect technical invalidation rather than arbitrary percentages. For example, beneath the breakout candle low or beneath a structural support level.
Accept only trades where the potential reward sufficiently exceeds the defined risk.
Avoid initiating positions on breakouts that coincide with ambiguous or unverified news and in low-liquidity environments.
These practices reduce the likelihood and impact of entries that coincide with false breakouts.
Experienced traders treat failed breakouts as actionable events. Typical approaches include:
Enter a short position once price falls back below the breakout level and confirms weakness, with a stop above the recent high.
Use options to limit downside risk while capitalising on an expected decline.
Employ volume-weighted average price (VWAP), order flow, or market profile to confirm the exhaustion of buyers before initiating a short.
Exploitation requires strict risk control because the market can reassert bullish strength; therefore, these strategies should be implemented with disciplined stops and position sizing.
| Feature | Bull Trap | Bear Trap |
|---|---|---|
| Direction of initial move | Upwards past resistance | Downwards below support |
| Trapped participants | Long buyers | Short sellers |
| Typical market context | During downtrends or range-bound markets | During uptrends or corrective rallies |
| Identification | Low volume, momentum divergence | Low volume on sell-off, lack of follow-through on downside |
| Typical exploitation | Short after confirmation | Long after confirmation |
A bull trap is a defined market phenomenon in which an apparent bullish breakout proves illusory and reverses, inflicting losses on traders who entered on the breakout.
Professional handling of breakouts requires a combination of technical confirmation, contextual analysis, disciplined risk management, and clearly defined trade rules.
By adopting rigorous verification standards and appropriate trade management techniques, traders can reduce their vulnerability to bull traps and, where appropriate, convert failed breakouts into profitable opportunities.
A bull trap typically forms when insufficient buying power supports a breakout. Contributing factors include low volume, transient algorithmic or news-driven spikes, and prevailing bearish sentiment that reasserts itself after an initial move.
A genuine breakout is normally accompanied by a noticeable increase in traded volume relative to recent averages, which indicates broad participation. Conversely, breakouts on below-average volume suggest the move is not broadly supported and therefore more likely to fail.
Waiting for a retest improves the probability that the breakout is genuine, but it is not mandatory. Traders with shorter time horizons may scale into positions or use smaller initial sizes. The crucial element is to have clear entry rules, defined stops, and a rationale for the chosen approach.
Yes, algorithms can exacerbate false breakouts through rapid execution and liquidity-taking behaviours. Retail traders should respond by demanding higher confirmation standards, avoiding entries based on single-session spikes, and respecting liquidity and order-flow signals.
Disclaimer: This material is for general information purposes only and is not intended as (and should not be considered to be) financial, investment or other advice on which reliance should be placed. No opinion given in the material constitutes a recommendation by EBC or the author that any particular investment, security, transaction or investment strategy is suitable for any specific person.