Published on: 2025-03-11
Updated on: 2025-08-20
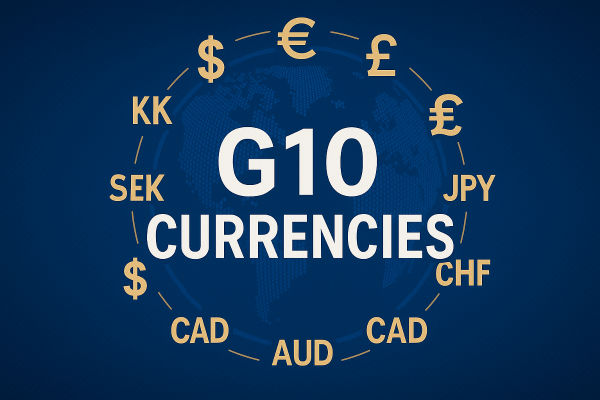
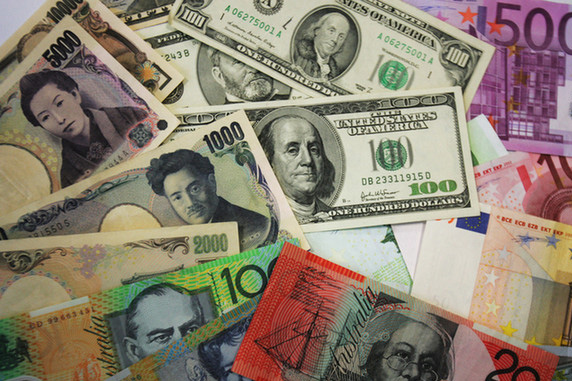
Whether you're trading USD/INR or EUR/USD, the G10 currencies shape nearly every move in the forex market. These 10 currencies: USD, EUR, JPY, GBP, CHF, CAD, AUD, NZD, NOK, and SEK, anchor liquidity, drive volatility, and determine the cost of hedging
These ten dominate global turnover, set the tone for risk-on/risk-off moves, and anchor pricing in forwards, futures, and options. The recent Bank for International Settlements (BIS) survey indicated that the USD was involved in 88% of all FX transactions, with the EUR at approximately 31%, the JPY at 17%, the pound at 13%, and the other G10 currencies significantly present in spot, forwards, and swaps.
This guide gives you a practical map of the G10 on what each currency "represents," the central bank in the driver's seat in 2025, and why the G10's flows matter for INR- and USD-based traders.

The G10 countries in forex aren't exactly the same as the political G10. In markets, it refers to the 10 most liquid and widely traded currencies.
USD (US Dollar)
EUR (Eurozone Euro)
JPY (Japanese Yen)
GBP (British Pound)
CHF (Swiss Franc)
CAD (Canadian Dollar)
AUD (Australian Dollar)
NZD (New Zealand Dollar)
SEK (Swedish Krona)
NOK (Norwegian Krone)
That's distinct from the historical Group of Ten countries. Brokers, exchanges, and research desks use the FX definition.
From an Indian or American trader's perspective, G10 liquidity matters because:
Tight spreads and deep order books lower your slippage and financing costs.
Macro data and central bank guidance arrive predictably, moving prices in well-telegraphed windows.
Hedging tools are abundant, from CME G10 futures and options to OTC forwards and swaps.

1) USD: The Global "Vehicle" Currency
In 88% of trades, someone buys or sells the dollar; commodities, trade invoices, and global funding are dollar-centric. In the US, the USD is foundational for traders; in India, the USD/INR serves as the key for cross trades and conversions.
Policy Pulse (2025)
The Fed's target range is 4.25–4.50% after 2025 cuts, with the effective fed funds rate printing in the 4.3–4.4% area in recent weeks. US macro still anchors global risk appetite and USD funding costs.
Why Indian Traders Care:
When the Fed keeps rates high, the dollar remains strong, making imports more expensive for India but rewarding exporters paid in USD.
2) EUR: Scale and Rate Cycles From the ECB
EUR anchors EUR/USD, the world's most traded pair; it's also the reference for European risk, energy sensitivity, and intra-Europe trade dynamics.
Policy Pulse (2025)
The ECB's deposit facility rate is ~2.00% after a cut from 2024 highs, a big shift from the 2022–23 inflation fight. Curve pricing and forward guidance are key for EUR crosses.
India/US Lens:
When Europe cuts rates faster than the U.S., the euro tends to weaken.
3) JPY: Rates, Carry, and BOJ Inflexion
The yen is the world's funding currency. When Japanese rates are low, investors borrow JPY to buy higher-yielding assets. Unwinds can be violent.
Policy Pulse (2025)
The BOJ increased its policy rate to approximately 0.5% in January and has maintained this rate until mid-2025, marking the highest level in 17 years and representing a significant shift from decades of near-zero rates.
BOJ minutes and statements explicitly discuss the pace of balance sheet runoff and future hikes if inflation durably converges near 2%.
Practical Take:
Traders borrow in yen to fund other trades. But if markets turn "risk-off," the yen can surge suddenly.
4) GBP: A "Rates-And-Growth" Story With High Beta
The pound is a macro-sensitive currency with deep derivatives markets. It responds strongly to the guidance from the Bank of England and unexpected changes in UK growth or inflation.
Policy Pulse (Aug 2025):
The BoE Bank Rate is ~4.00% after recent cuts, still high enough to carry a material yield versus EUR and JPY but well off 2023–24 peaks.
India/US Lens:
The pound often rises when investors are optimistic and falls when markets turn cautious.
5) CHF: The Safe-Haven Thermometer
The Swiss franc represents a combination of liquidity and safety, often experiencing gains during periods of global financial uncertainty.
Policy Pulse (2025)
The SNB's policy rate is 0.00% after cuts, with inflation near zero. CHF strength often has more to do with risk sentiment than carry.
India/US Lens:
Investors buy francs when nervous, but the SNB may step in if it rallies too far.
6) CAD: Oil-Linked North American Liquid
CAD blends commodity terms of trade (oil) with North American growth. It's tightly integrated with US cycles and data.
Policy pulse (2025)
The BoC overnight target is ~2.75%, having eased materially from restrictive levels as inflation cooled.
India/US Lens:
Think of CAD as a leveraged oil play.
7) AUD: Global Growth and China Sensitivities
Australia's currency is a beta play on global growth, China's cycle, and metals demand. Markets price AUD as a clean way to express "risk-on" or "risk-off."
Policy Pulse (2025):
The RBA cash rate is ~3.60%, with the bank signalling data-dependence as inflation drifts lower.
India/US Lens:
AUD rises when traders feel "risk-on" and falls when global growth looks shaky.
8) NZD: Small, Liquid, and Rate-Sensitive
NZD acts like a high-beta, interest-rate-sensitive currency that reacts strongly to dairy and commodity terms of trade, as well as guidance from the RBNZ.
Policy Pulse (2025):
The RBNZ OCR is ~3.00%, down from its peak, as the central bank calibrates against softer activity.
India/US Lens:
NZD fluctuations can precede AUD changes or amplify shifts in risk appetite, helpful for timing entries in larger G10 risk portfolios.
9) NOK: Oil Lever With Nordic Nuance
Norway's krone is a liquid proxy for Brent crude and a popular carry leg when Norges Bank is relatively hawkish.
Policy Pulse (2025):
Norges Bank's policy rate is ~4.25%, still elevated versus peers despite disinflation.
India/US Lens:
If oil spikes, NOK often outperforms. For India (a net oil importer), that scenario can pressure INR. Thus, watch USD/INR alongside USD/NOK for a composite view of energy risk.
10) SEK: High-Beta Europe With Tech/Credit Sensitivity
The Swedish krona tracks European and global growth sentiment, with high beta to risk cycles, tech equity performance, and Riksbank policy.
Policy Pulse (2025)
The Riksbank policy rate is ~2.00% after a series of cuts from 2024 highs. Markets debate how quickly easing will continue.
India/US Lens:
SEK tends to weaken when Europe slows or markets get nervous.
For traders in India (IST) and the U.S. (EST), timing matters.
London Session (12:30–21:30 IST / 7:00–16:00 GMT): Most active for EUR, GBP, CHF.
New York Session (19:00–02:00 IST / 14:00–21:00 GMT): Best for USD crosses and commodities.
Asia Session (05:30–14:30 IST / 00:00–09:00 GMT): Ideal for JPY, AUD, NZD pairs.
Liquidity reaches its peak during the overlap of the London and New York trading sessions. It is when spreads tighten and volatility creates tradeable opportunities.

1) Anchor to Policy Differentials
Cross-check the Fed–ECB gap for EUR/USD bias, Fed–BoJ for USD/JPY, and RBI–Fed for USD/INR forwards.
In August 2025, the Fed is more restrictive than the majority of G10, whereas the BOJ has slightly increased from zero; this combination favours USD against low-yielding currencies.
2) Use Commodities as Confirmation
Gains in Brent combined with a strong NOK/CAD usually confirm a narrative about global growth or supply risks, affecting INR (import expenses) and DXY (trade terms).
3) Trade the Calendar, Not Just the Chart
Pre-position or trade post-print on US CPI/Payrolls, ECB/BoE policy days, and BOJ meetings. Liquidity and volatility concentrate in these windows, and spreads are sharper.
4) Hedge INR Exposures via G10 Baskets
If your profit and loss statement is in INR, but your risk exposure is global, using a basket of G10 hedges can hedge against macroeconomic shocks more effectively than simply trading USD/INR, especially when there is limited liquidity for INR onshore.
5) Size Positions by Regime
During risk-off periods, reduce time frames and tighten stops in high-beta G10 (AUD/NZD/SEK). In reflation, give AUD/NZD/NOK more room but monitor China and energy.
1. Which Currencies Make Up the G10 Countries?
The G10 currencies include the U.S. Dollar (USD), Euro (EUR), Japanese Yen (JPY), British Pound (GBP), Swiss Franc (CHF), Canadian Dollar (CAD), Australian Dollar (AUD), New Zealand Dollar (NZD), Norwegian Krone (NOK), and Swedish Krona (SEK).
2. Why Do G10 Currencies Dominate the Forex Market Compared to Emerging Market Currencies?
G10 currencies are backed by stable economies, central banks, and deep liquidity, making them less prone to sudden crashes.
3. Can Indian Investors Trade G10 Currencies Directly?
Yes, Indian investors can trade certain G10 currencies such as USD/INR, EUR/INR, GBP/INR, and JPY/INR on regulated exchanges. However, direct trading of exotic G10 pairs (like AUD/NZD or NOK/SEK) usually requires international forex brokers like EBC.
4. Can Beginners Start With G10 Pairs?
Absolutely. Pairs like EUR/USD and GBP/USD are liquid, transparent, and less volatile than many EM pairs, making them ideal for learning.
In conclusion, G10 currencies are the gears inside the FX machine. For traders in India and the U.S., the G10 isn't just background noise; track central banks, watch commodities, and respect liquidity cycles. That's how you turn G10 flows into opportunity with precision.
Thus, keep one eye on the BIS turnover map, another on central bank rate paths, and a third (metaphorically) on oil and equity volatility. For INR and USD traders alike, that triangulation is how you turn G10 noise into a coherent, tradable signal.
Disclaimer: This material is for general information purposes only and is not intended as (and should not be considered to be) financial, investment or other advice on which reliance should be placed. No opinion given in the material constitutes a recommendation by EBC or the author that any particular investment, security, transaction or investment strategy is suitable for any specific person.